

Big money is moving into small gold stocks | Anthony Milewski on The Deep Dive
From The Precious Metals Summit Beaver Creek, Anthony Milewski, Founder of The Oregon Group, joins The Deep Dive to discuss why capital is finally reaching small gold explorers after years of limited funding—and what that means for drilling, discoveries and investors.
Anthony explains how U.S. investors, exchange listings and greater trading liquidity are changing the funding landscape. He also shares his warning about critical metal stocks, his outlook for nickel, and how deep-sea mining could eventually disrupt metal supplies.
The Deep Dive closes with Anthony’s prediction that gold will reach new all-time highs within the next 12 months, even with interest rates increasing. He explains why government spending and election-cycle money printing underpin his conviction—and why his outlook for silver is less certain.
China becomes zinc exporter as metal flows into LME warehouses
- China exported 40,668 metric tonnes of refined zinc in August, its second-highest monthly volume in almost 20 years
- the country became a net exporter of 4,388 metric tonnes over the first eight months of 2026, reversing its traditional position as a major net importer
- LME zinc inventories rose from 88,000 metric tonnes in mid-August to 126,975 metric tonnes in early October as metal arrived in Hong Kong, Singapore and Taiwan
China exported 40,668 metric tonnes of refined zinc in August — more than four times the July volume — as a shortage of immediately available metal on the London Metal Exchange opened a profitable route from Chinese smelters to Asian warehouses.
The August total was China’s second-highest monthly zinc export volume in almost two decades, according to World Bureau of Metal Statistics data compiled from Chinese customs figures.
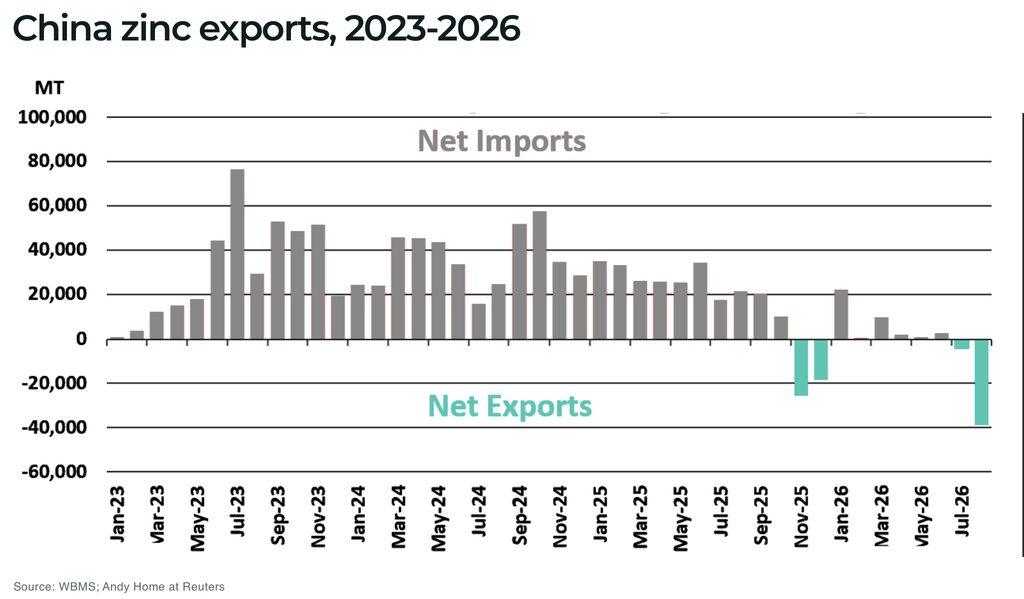
Imports, meanwhile, fell to approximately 2,300 metric tonnes in August. China exported a net 38,300 metric tonnes during the month and became a net exporter of 4,388 metric tonnes across January to August.
China has historically absorbed refined zinc from the international market, but is now supplying metal to a Western market struggling with mine disruption, low smelter margins and high energy costs.
What happened in September?
China’s official September zinc trade figures are not yet available, as the latest published monthly Chinese trade statistics cover August, meaning September exports should not yet be quoted as a confirmed customs figure — however, the physical evidence nevertheless suggests shipments continued.
LME warehouses in Hong Kong received 35,000 metric tonnes of zinc from mid-August to early October, and Singapore received 21,250 metric tonnes and Kaohsiung in Taiwan received 16,725 metric tonnes.
Those movements overlap with August and cannot be treated as a separate September export total, but almost daily deliveries into Hong Kong during September indicate that the August export wave did not stop at month-end.
Shanghai Metals Market also reported that the export window remained open during September as the price of zinc outside China continued to exceed the domestic market after adjusting for currency, freight and other costs. However, it expects exports to be lower than August as the arbitrage opportunity narrows.
| Market indicator | August 2026 | Position by early October |
|---|---|---|
| Chinese refined-zinc exports | 40,668 metric tonnes | September customs total not yet available |
| LME registered zinc stocks | 88,000 metric tonnes at the mid-August low | 126,975 metric tonnes |
| LME three-month zinc | Four-year high of US$4,065 per metric tonne in early September | Approximately US$3,715 per metric tonne |
| Cash premium over three-month metal | US$215 per metric tonne in late August | Approximately US$60 per metric tonne |
Chinese exports have therefore relieved the immediate squeeze, but they have not eliminated it.
The cash price still trades above the three-month contract, a market structure known as backwardation that signals buyers continue to pay a premium for immediately available zinc.
China’s zinc surplus meets a Western smelting problem
The export surge reflects a growing split between Chinese and Western zinc markets.
Weak construction activity has weighed on Chinese demand for galvanized steel, while the country’s refined-zinc production increased by 5.9% during the first half of 2026, refined production outside China fell 3.4% over the same period.
The raw-material market is tighter with global zinc mine production declining by 2.6% year over year in the first half, as major operations including Antamina in Peru and Red Dog in Alaska processed lower-grade ore.
Competition between smelters for concentrates pushed spot treatment charges (the fees miners pay smelters to process their material) to a reported minus US$113 per metric tonne in August. These negative charges transfer value from the smelter to the miner and place severe pressure on processing margins.
Europe ,meanwhile, faces the added burden of high electricity costs. For example:
- Nyrstar launched a strategic review of its 315,000-metric-tonne-per-year Budel smelter in the Netherlands on September 24, citing Chinese overcapacity, competition for feedstock, historically low treatment charges and elevated European energy costs
- Budel continues to operate while the review is under way, so closure should not be treated as decided
Further reductions in Western smelting capacity would deepen the dependence now visible in the LME market.
China is becoming the market’s balancing supplier
China’s zinc shipments have lowered prices and rebuilt exchange inventories which, in the short term, is bearish for the LME price and helpful for consumers of galvanized steel.
However, the longer-term signal with zinc is more complicated.
The current squeeze is rooted partly in falling mine supply and weakening smelter economics. Moving Chinese metal into LME warehouses treats the shortage of deliverable zinc; it does not repair Western processing capacity or increase the supply of concentrate.
As our earlier analysis of volatility in critical zinc supply highlighted, small disruptions can have an outsized effect on a market already exposed to declining ore grades, energy costs and concentrated refining capacity.
China is on course to become a net annual zinc exporter for the first time since 2022 — and the strategic point is simple: the West is trying to reduce its dependence on Chinese processing for critical minerals, yet the LME zinc market increasingly needs Chinese smelters to supply its metal of last resort.
The next test will be China’s September customs figures. If exports remained near August’s elevated level, the LME squeeze could continue to unwind. If shipments fall as the arbitrage closes, the cash premium may widen again, revealing how little spare zinc is available outside China.
FAQ
How much zinc did China export in August 2026?
China exported 40,668 metric tonnes of refined zinc, the second-highest monthly total in almost 20 years.
Did Chinese zinc exports continue in September?
LME warehouse arrivals and Chinese market data indicate shipments continued, but September customs figures have not yet been published. The final volume therefore remains unconfirmed.
Why is China exporting zinc?
LME zinc prices rose relative to Shanghai prices, creating an arbitrage opportunity to buy Chinese metal and ship it to LME-approved warehouses in Asia.
Has the LME zinc squeeze ended?
No. Registered inventories have recovered and the cash premium has narrowed, but cash zinc still trades above three-month metal, indicating continued tightness in immediately available supply.
Why does this matter for investors?
Chinese exports can suppress prices in the near term, while falling mine production, negative treatment charges and pressure on Western smelters support a tighter medium-term supply outlook.
Google nears $1 billion nuclear deal as Big Tech locks in America’s reactor fleet
- Google is reportedly nearing a multiyear nuclear power agreement with Constellation worth at least US$1 billion
- the talks follow Amazon’s 690 MW Constellation deal and a US$4.2 billion conditional federal loan commitment for Vistra’s nuclear fleet
- US tech companies are backing reactor life extensions, restarts and new construction, with different implications for future uranium demand
Google is nearing an agreement to purchase nuclear electricity from Constellation Energy for US$1 billion or more over several years, according to Bloomberg, in a deal that could be announced as soon as this week.
Neither company confirmed the talks, and the generating capacity, plant location and detailed terms remain undisclosed — and the reported value represents electricity purchases over the agreement’s life.
The potential deal comes less than a week after Amazon signed a 20-year agreement for 690 MW from Constellation’s Calvert Cliffs nuclear plant in Maryland, as America’s technology companies compete to secure power for expanding AI and cloud infrastructure. The Amazon-Constellation agreement includes approx 190 MW of additional generating capacity expected between 2030 and 2032. Constellation says the agreement will support more than US$3 billion in infrastructure investment and help underpin a further 20 years of plant operation.
The scale of tech’s nuclear push to power data centers and AI is becoming clear with selected US technology and data-centre nuclear announcements now representing an estimated cumulative 29.8 GW of capacity, as the chart below shows.
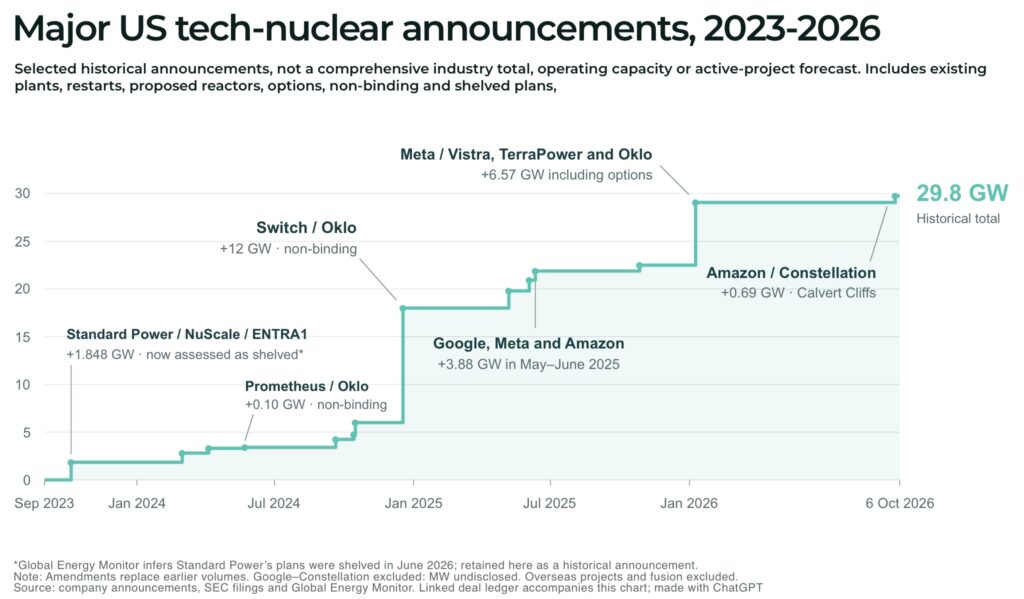
Note: the figure measures the scale of announced ambitions, not operating capacity or guaranteed future supply.
And, for the uranium supply chain, the distinction matters as purchasing electricity from an operating reactor does not automatically create additional fuel demand, but increasing its output, extending its life or bringing a closed plant back into service can strengthen demand over years or decades.
Washington adds US$4.2 billion to the picture
On October 5, the US Department of Energy announced a conditional loan commitment of up to US$4.2 billion for upgrades and modernisation at Vistra’s Beaver Valley plant in Pennsylvania and its Davis-Besse and Perry plants in Ohio.
The projects aim to preserve nearly 4 GW of existing generation and add 433 MW of capacity. They would also support operation for another 20 years beyond the plants’ existing licences.
These are the same three Pennsylvania and Ohio plants covered by Meta’s January agreements with Vistra, when Meta committed to buying more than 2.1 GW from existing generation, alongside 433 MW of planned additional output. (The federal financing and corporate purchases therefore support overlapping projects; the capacity figures should not be added together).
A similar combination is developing in Iowa. In September, the Department of Energy closed a loan of up to US$1.9 billion to help NextEra Energy restart the 615 MW Duane Arnold plant. Google’s 25-year electricity agreement underpins that project, which targets a return to service in early 2029, subject to regulatory approval.
The US tech–nuclear tie-ups (so far)
The major publicly announced US-focused partnerships span operating reactors, planned restarts and technologies still under development:
| Technology company | Nuclear partner | Agreement and development status |
|---|---|---|
| Constellation | Reported Google–Constellation nuclear power agreement worth at least US$1 billion over several years. Capacity, location and duration undisclosed; not yet confirmed. | |
| Kairos Power | October 2024 advanced nuclear energy agreement supporting up to 500 MW, with initial deployment targeted for 2030 and further reactors through 2035. | |
| Elementl Power | May 2025 US nuclear site development agreement providing early capital for three potential sites of at least 600 MW each. Google has an option to purchase electricity; these are development targets. | |
| NextEra Energy | October 2025 25-year power agreement supporting the restart of Iowa’s 615 MW Duane Arnold nuclear plant, targeted for early 2029. CIPCO will purchase the remaining portion of output. | |
| Microsoft | Constellation | September 2024 20-year agreement supporting the Three Mile Island Unit 1 restart as the 835 MW Crane Clean Energy Center. Constellation’s August 2026 update targets Crane nuclear plant operations in 2027. |
| Amazon / AWS | Talen Energy | June 2025 Amazon–Talen nuclear power agreement expanding supply to 1,920 MW from Susquehanna through 2042, reaching full contracted volume no later than 2032. Includes exploration of uprates and SMRs. |
| Amazon | Constellation | September 2026 20-year Calvert Cliffs nuclear power agreement for 690 MW, including approximately 190 MW of new capacity targeted for 2030–2032. |
| Amazon | X-energy / Energy Northwest | Investment and development partnerships supporting the Cascade small modular reactor project in Washington: 320 MW initially, expandable to 960 MW, with operations targeted for the 2030s. |
| Amazon | Dominion Energy | October 2024 agreement to explore a small modular reactor project near North Anna in Virginia, with at least 300 MW of capacity. An exploratory arrangement. |
| Meta | Constellation | June 2025 20-year Clinton nuclear energy agreement, beginning in 2027, supporting continued operation of the Illinois plant and 1,121 MW of nuclear generation. |
| Meta | Vistra | January 2026 Meta–Vistra nuclear power agreements covering 20 years, more than 2.1 GW of existing generation and 433 MW of uprates at Perry, Davis-Besse and Beaver Valley. |
| Meta | TerraPower | January 2026 TerraPower Natrium reactor development agreement supporting two units totalling 690 MW, potentially delivering from 2032, plus rights to energy from six further units. Total potential baseload capacity: approximately 2.8 GW. |
| Meta | Oklo | January 2026 development partnership supporting a proposed 1.2 GW advanced nuclear campus in Ohio, potentially beginning operations from 2030. |
| Switch | Oklo | December 2024 non-binding advanced nuclear power agreement targeting 12 GW of deployment through 2044. A framework for future projects. |
| Equinix | Oklo / Radiant | Equinix nuclear energy partnerships include a 2024 agreement for 500 MW from Oklo and an August 2025 preorder for 20 Radiant microreactors. Both concern future deployment. |
The next constraint is delivery
The commercial logic is becoming clearer: long-term technology customers can give nuclear operators greater revenue certainty, helping justify investment in existing plants and future projects.
But contracts alone cannot deliver reactors, regulatory approvals or fuel.
Washington is addressing the supply chain alongside generation. For example, in January, the Department of Energy announced US$2.7 billion for domestic uranium enrichment services over the next decade, covering conventional low-enriched uranium and the higher-assay fuel required by several advanced reactor designs.
Google’s reported Constellation agreement would add another major buyer to that market. The details still to come — where the power originates, when delivery begins and whether the contract enables additional generation — will determine how much it changes the supply picture.
AI Has A Commodity Problem—And The Technology Industry Isn’t Ready For It
For most of the past two decades, the technology industry has operated as if the physical world were somebody else’s problem.
Software companies scaled without building factories. Cloud computing let businesses add capacity without worrying much about what sat behind it. Even when technology companies moved into hardware, global supply chains generally delivered what they needed.
The AI boom gets discussed mostly in terms of semiconductors, computing power and electricity. All three matter. But underneath them sits a constraint that receives far less attention: commodities.
Data centers are physical infrastructure. So are the power plants, transmission lines, substations, transformers and cooling systems required to run them. Building all of this requires enormous quantities of copper, aluminum, steel and other materials. Expanding electricity generation brings uranium and natural gas into the equation. Semiconductor manufacturing depends on its own set of specialty metals—including gallium, germanium, palladium, and silicon—whose supply chains are heavily concentrated outside Western control.
Technology companies are becoming dependent on industries that move very slowly. That’s a new problem for an industry accustomed to moving at digital speed.
AI Is More Physical Than It Looks
When a user types a question into a phone and gets an answer in seconds, the experience feels almost entirely digital.
AI requires large data centers filled with advanced computing equipment. Those facilities need enormous electricity. Electricity requires generation. Generation needs transmission. Transmission requires copper, aluminum and electrical equipment. Data centers require construction materials, cooling infrastructure and backup power.
Copper is the clearest example of how these layers connect. It sits in transformers, transmission systems, data centers and power generation. Copper demand is already being pulled simultaneously by electrification, grid modernization and renewable energy—and AI infrastructure is now adding to that pressure. If AI electricity demand keeps growing, the industry won’t just need more chips. It will need considerably more of the infrastructure surrounding those chips.
America’s $27 billion push to break China’s minerals grip
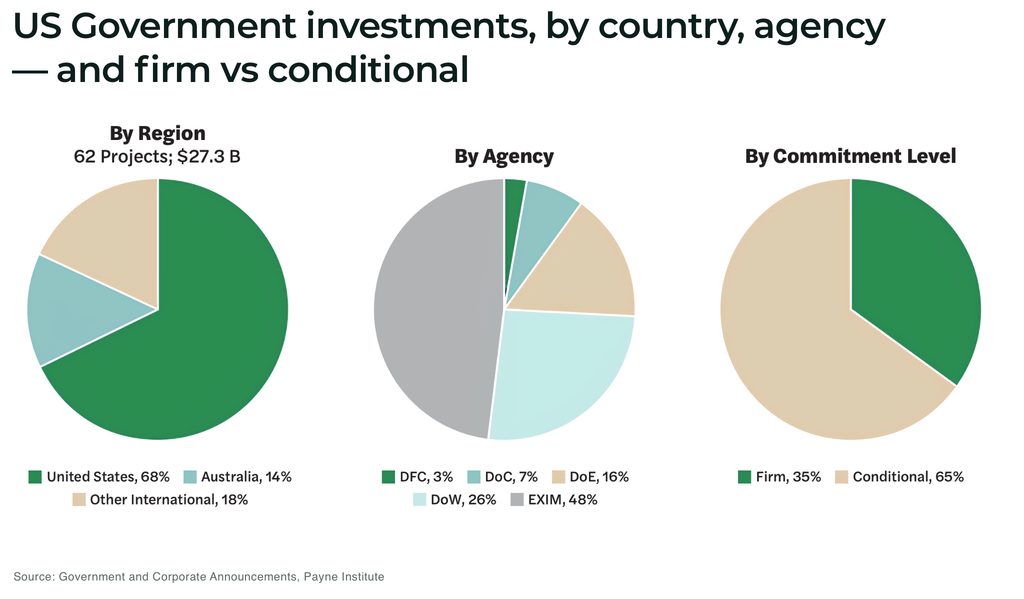
The US has committed or conditionally committed at least US$27.3 billion to 62 critical minerals projects since the start of 2025, according to the Payne Institute’s State of Critical Minerals Report 2026 — as Washington takes a leading role in financing alternatives to China-dominated supply chains.
The commitments span nine countries and more than three dozen minerals, withpprox 68% of their value targets US projects, with Australia accounting for another 14%.
The scale matters, but the more consequential shift is how Washington is putting its balance sheet to work: taking equity stakes, providing loans, supporting prices and backing customers’ purchases.
Together, these interventions help address the question that determines whether a mineral deposit becomes an operating business, will someone finance construction, and whether the producer earn enough to keep running.
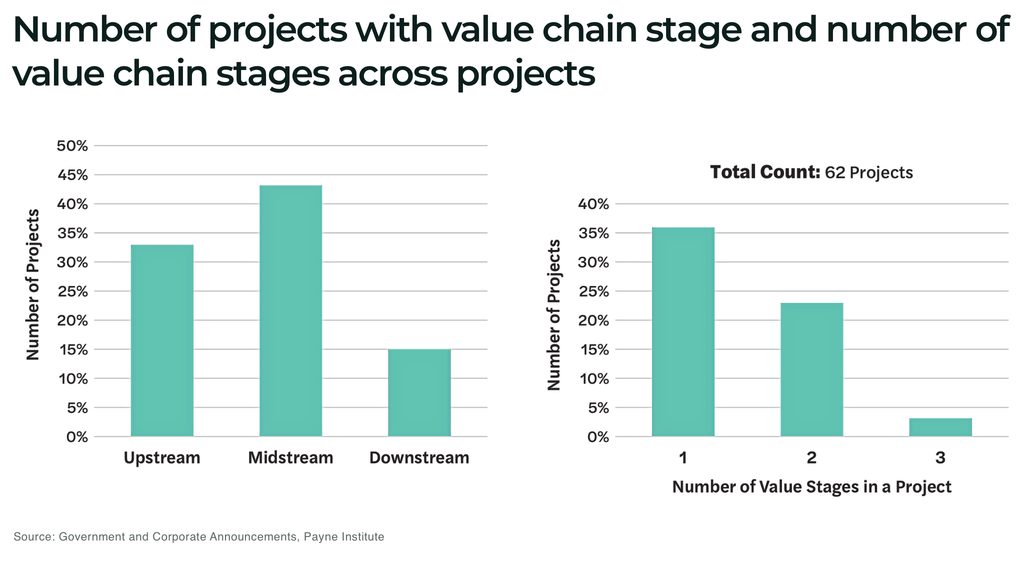
The majority of the investments made upstream (eg mining) and/or midstream (eg refining or processing), as well as 15 include a downstream (eg product manufacturing) component.
The push comes against a difficult investment backdrop. Global critical mineral investment fell 9% in 2025, while spending by battery metals companies dropped more than 20%, according to the International Energy Agency’s latest outlook.
Washington is increasingly willing to absorb risks that private investors struggle to price.
For example, MP Materials illustrates the approach: its July 2025 Pentagon agreement combined a US$400 million preferred-equity investment with a ten-year US$110-per-kilogram price floor for its neodymium-praseodymium products. The package also included a ten-year commitment to ensure purchases of all magnets produced by its planned 10X facility. That protection is already appearing in company accounts. MP reported US$17.6 million in price-protection income in the second quarter of 2026, alongside US$108.5 million in revenue.
For investors, the significance extends beyond one company as a government-backed price floor can help reduce exposure to a market downturn; a purchase commitment can give lenders greater confidence that new capacity will have customers; equity and loans help pay for construction.
The US is also financing protection against supply interruptions when, in February, the Export-Import Bank approved a direct loan of up to US$10 billion for Project Vault, a public-private strategic critical minerals reserve intended to store materials for American manufacturers.
The new research identifies the US as a major driver of critical mineral investment diversification — and the leading player in the Western hemisphere — howeer does not establish that America has overtaken China in mineral supply investment.
Nor does every US announcement represent secured funding. Payne classifies 65% of the US$27.3 billion as conditional, with 35% firm. Even firm commitments should not be confused with disbursements or operating capacity.
The institute’s central recommendation is therefore consequential: support complete supply chains. A new mine cannot remove dependence if its output must still pass through a vulnerable processing bottleneck. A refinery needs reliable feedstock both need customers.
America is helping change the financing terms for critical minerals. The next test is whether those commitments produce complete, commercially durable supply chains.
US announces US$15 billion Iowa steel mill, boosting manganese and graphite electrode demand
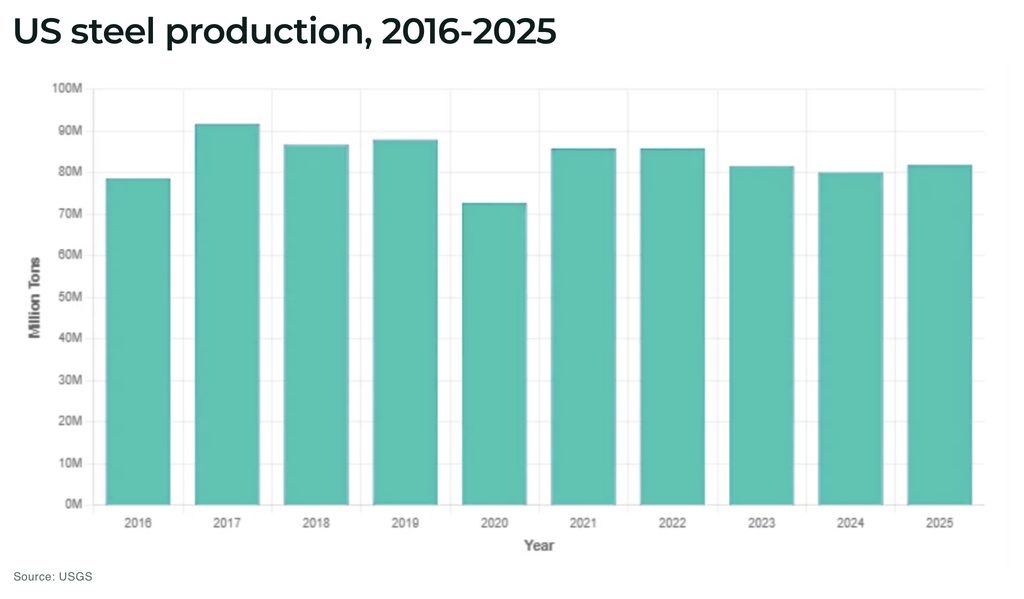
Mesabi Metallics plans to invest US$15 billion in an Iowa steel complex capable of producing an initial 7.5 million US tons annually, rising to approximately 10 million tons in later phases.
The planned electric arc furnace complex will use direct-reduction-grade iron pellets from Mesabi’s new mine and processing operation in Nashwauk, Minnesota, creating a domestic supply chain from ore extraction to finished steel.
The wider US$18 billion Mesabi investment comprises approx US$3 billion for the Minnesota mine and pellet plant and US$15 billion for the Iowa steelmaking complex. The US Export-Import Bank approved a US$770 million direct loan for the mine, but Mesabi has not disclosed complete financing, permitting or construction details for the US$15 billion Iowa plant.
The Iowa development is designed to produce up to 7 million tons of high-grade pellets annually, and expected to support more than 6,000 construction jobs and employ approx 1,750 people once operational.
The project could reduce US reliance on imported iron products, but producing steel domestically does not make the entire supply chain domestic.
Steelmaking shifts the mineral bottleneck
Electric arc furnaces require scrap or direct-reduced iron, electricity, graphite electrodes and alloying materials. The exact requirement will depend on Mesabi’s feed mix and the steel grades it intends to produce, neither of which has been disclosed:
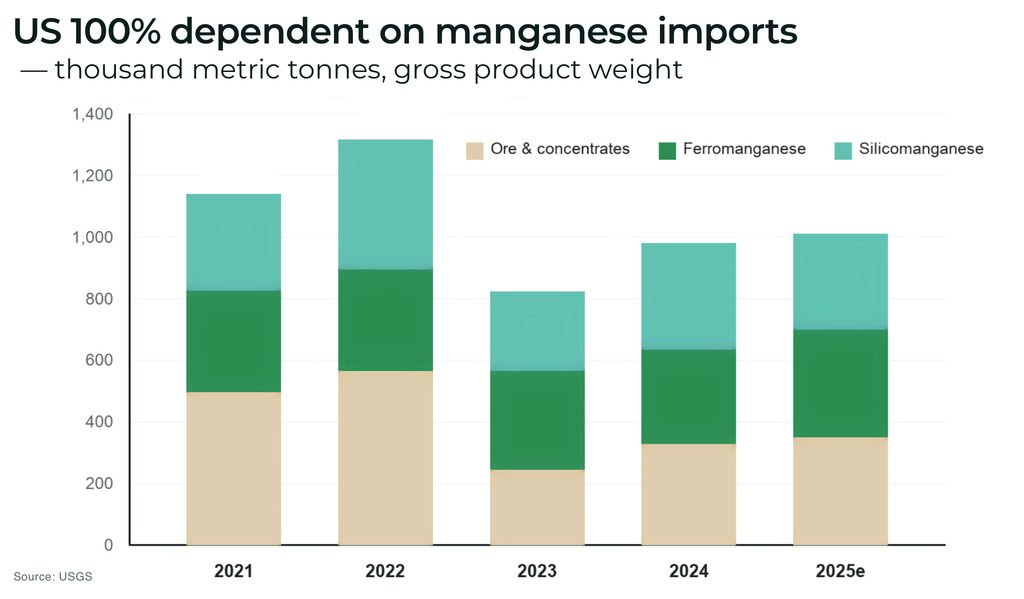
Manganese is the clearest exposure: the mineral is essential for removing sulphur and oxygen and improving steel strength — and the US was 100% net import reliant for manganese in 2025, with Gabon, South Africa, Malaysia and Australia supplying most imports.
At the Iowa plant’s initial capacity — equivalent to about 6.8 million metric tonnes — the mill could require approximately 41,000–61,000 metric tonnes of contained manganese annually. The estimate applies the USGS range of 6–9 kilograms of manganese for every metric tonne of steel and is illustrative rather than company guidance.
The furnaces will also consume graphite electrodes. Applying the approx 1.7 kilograms used per metric tonne of EAF steel implies demand of around 12,000 metric tonnes annually at initial capacity. These electrodes are primarily manufactured from synthetic graphite and petroleum needle coke, rather than mined natural graphite.
Demand for chromium, nickel, vanadium, niobium, boron and silicon will depend on whether the new steel mill produces stainless, automotive, defence or other high-strength steels — the Department of Energy identifies these materials as critical inputs for steel production and strengthening.
Feedstock could present another constraint, with high-specification EAF steel requires low-contaminant scrap or additional virgin iron units to dilute copper and other residual metals, and the US Department of Energy expects prime scrap availability to tighten as more mills move towards electric production.
Mesabi’s project may well anchor a major domestic iron and steel corridor, but its wider strategic value will depend on whether the US can also secure the imported ferroalloys, graphite electrodes, high-quality scrap and energy needed to keep it running.
US critical minerals reserve adds US$1 billion through Glencore and Mercuria
The US has secured its first US$1 billion of procurement commitments for Project Vault, moving the planned strategic critical-minerals reserve from government financing approval towards physical stockpiling.
- Glencore announced a separate US$500 million commitment backed by financing from the US Export-Import Bank
- Mercuria committed US$500 million to the reserve on September 23, 2026
Mercuria describes its contribution as a commitment to Project Vault, while Glencore says the EXIM financing will allow it to source, procure and deliver minerals to the reserve. The combined US$1 billion is therefore not US$1 billion of new government spending, or necessarily US$1 billion of private capital — but it moves the project from concept to execution.
Glencore and Mercuria will use their trading, logistics and risk-management networks to purchase minerals globally and deliver them to VaultCo, the private company responsible for implementing the critical minerals reserve.
Neither company disclosed which minerals it will purchase, the volumes involved, the supplying countries or when deliveries will begin.
Project Vault moves from approval to procurement
President Donald Trump announced Project Vault in February 2026 after Chinese export restrictions exposed the vulnerability of US manufacturers to interruptions in rare earths and other critical materials.
The EXIM board approved a direct loan of up to US$10 billion to finance the reserve, while the wider plan combines that lending capacity with approximately US$2 billion of private capital.
Unlike the Pentagon’s National Defense Stockpile, Project Vault is a US $12 billion public-private partnership, backed by a $10 billion loan from the Export-Import Bank of the United States (EXIM), designed principally for civilian manufacturers. Participating companies will specify the materials and grades they need, while traders purchase, transport and manage inventories stored at facilities across the US.
Boeing, GE Vernova, battery manufacturer Clarios and data-storage group Western Digital were among the companies initially identified as potential industrial users. Mercuria, Hartree Partners and Traxys were named as the original suppliers.
Seven months after the launch, the Mercuria and Glencore agreements provide the first clear evidence that the financing framework is being converted into purchasing capacity. The two traders can aggregate demand from manufacturers that lack the scale or expertise to contract directly with overseas mines and processors.
But important details remain undisclosed. VaultCo has not published its target mineral list, inventory volumes, acquisition prices, storage locations or drawdown rules. Its independent, industry-led structure has also raised questions about transparency and oversight, given the size of the federal loan supporting it.
Critical mineral stockpiles could absorb 10% of key metals supply
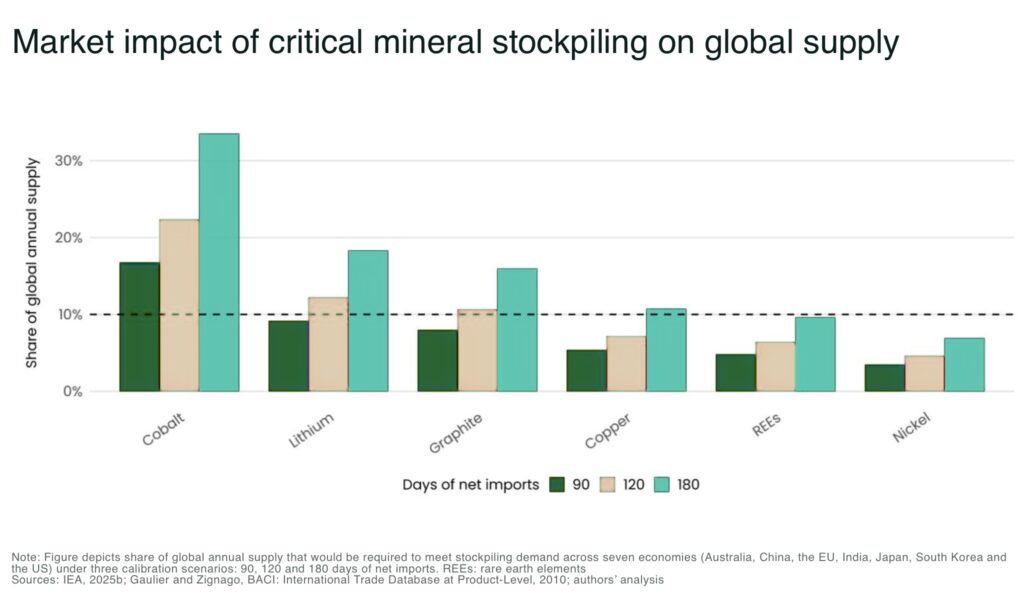
A recent report by the London School of Economics warns that simultaneous buying by Australia, China, the EU, India, Japan, South Korea and the US could consume up to 34% of global cobalt supply under a modelled 180-day net-import scenario.
Lithium, graphite and copper would each face stockpile demand exceeding 10% of annual supply.
The latest commitments do not yet prove that the US has a functioning minerals reserve. They do show that Project Vault has moved beyond a US$12 billion financing plan and begun assembling the commercial network needed to buy and store material.
China’s gold imports top 1,000 tonnes, highest January-August total since 2017
China imported more than 1,000 tonnes of gold in the first eight months of 2026, exceeding its purchases for the whole of last year — with imports reaching their highest level for the period in customs records dating back to 2017.
Lower international prices and a stronger yuan encouraged purchases and investment demand, while Chinese gold prices traded above global benchmarks, drawing metal into the country.
The import bill reached US$158.8 billion, compared with US$96.5 billion for 886 tonnes across all of 2025, according to Financial Times figures reported by International Finance.
The two major sources of buying include:
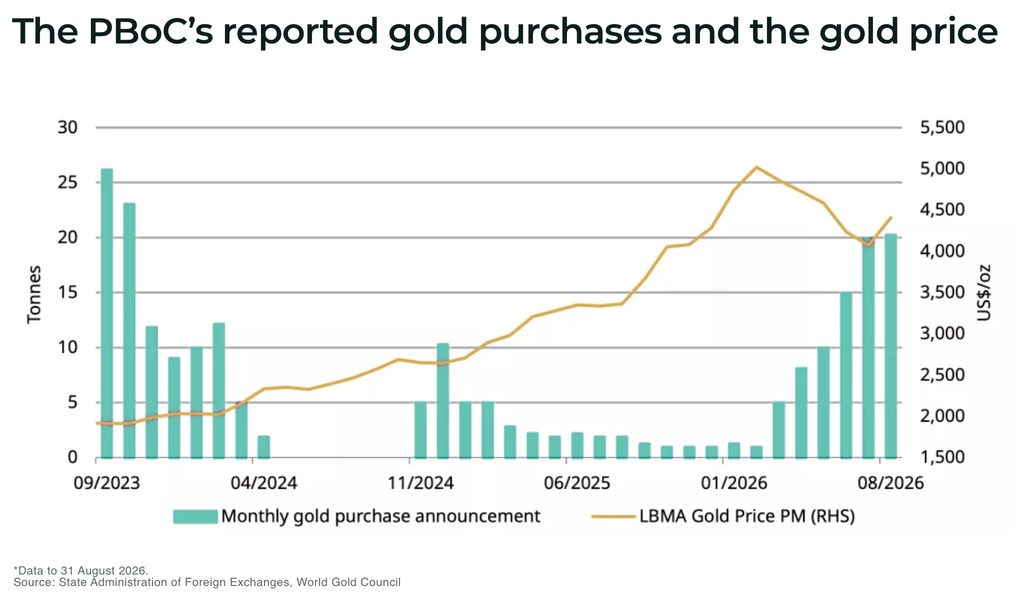
- Central-bank reserves: the People’s Bank of China added 20.2 tonnes in August, its largest monthly purchase since October 2023. Its 22nd consecutive monthly increase lifted official holdings to 2,387 tonnes, equivalent to 9% of foreign-exchange reserves
- Investment funds: Chinese gold ETFs added 11 tonnes in August, taking holdings to 293 tonnes. Inflows continued into early September, supported by falling domestic bond yields and sluggish equities
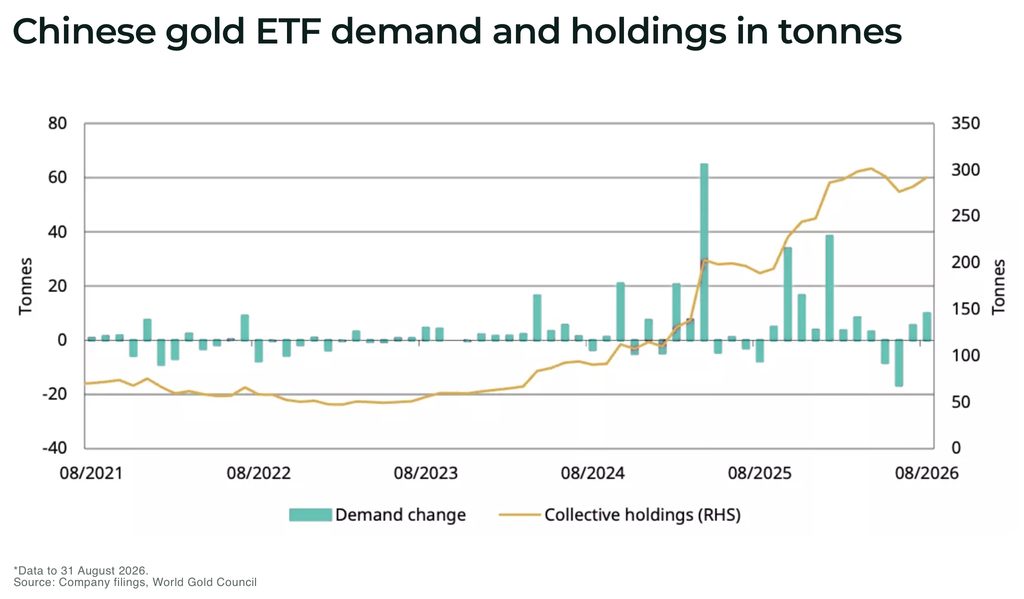
Official reserve additions and commercial imports are separate measures; the 1,000-tonne import figure should not be read as central-bank buying.
The scale is substantial: China’s eight-month imports exceeded a quarter of the approx 3,672 tonnes mined worldwide in 2025, when mine production grew just 1%. Imports can also include recycled metal and existing inventories.
However, physical demand softened in August. Shanghai Gold Exchange withdrawals fell 22% month-on-month and 27% year-on-year to 62 tonnes, reflecting cooler bullion investment and weak jewellery demand.
For gold investors and miners, the figures suggest continued support from reserve diversification and investment flows. Sustained Chinese buying could help absorb selling elsewhere, although August’s wholesale slowdown shows that buyers remain sensitive to price and volatility.
The AI Boom Is Creating a New Energy Supply Chain — and a Major Business Opportunity for Founders
The AI Energy Crisis Is Creating a Business Opportunity Most Founders Haven’t Noticed Yet
Key Takeaways
- AI’s next bottleneck may be electricity, not computing power.
- The real startup opportunity is in the messy infrastructure behind nuclear power.
- Founders who understand physical supply chains early could build the next essential AI businesses.
For the past several years, building an AI company has largely meant competing for computing power. Founders raced for GPU access. Investors poured capital into data centers. The bottleneck everyone talked about was chips — who had them, who could get more, who was building the next generation.
The International Energy Agency estimates global data-center electricity consumption could roughly double from 485 terawatt-hours in 2025 to around 950 TWh by 2030. AI-focused data centers are expected to grow even faster — roughly tripling over the same period. In the United States, data centers are expected to account for nearly half of all electricity demand growth through 2030.
The constraint shaping the next phase of AI isn’t algorithms or chips. It’s power. And the business sitting inside that problem is largely unaddressed.
What’s actually happening
The physical footprint of AI is expanding faster than most founders realize.
The IEA estimates that by 2027, a single advanced data-center server rack could have peak electricity demand equivalent to 65 households. A hyperscale facility needs enormous quantities of reliable power around the clock — not when the sun is shining or the wind is blowing, but continuously, every hour of every day.
For most of the internet era, electricity was an operating expense. You built where power was cheap, bought what you needed from the grid, and moved on. That model is breaking down.
Electricity is becoming infrastructure that has to be secured years in advance. The IEA estimates grid and infrastructure constraints could delay roughly 20% of planned data-center projects. Where AI infrastructure gets built may increasingly be determined by who can secure power — not who has the best model or the most capital.
Two multi-billion dollar uranium exits. Can Mike Beck do it again at Skeleton Coast Uranium?
EPISODE 24: Anthony Milewski and Christian Purefoy chat to special guest investor Mike Beck about the price of uranium and the supply-demand dynamic that may push the price significantly higher to $200.
Two multi-billion dollar uranium exits. Can Mike Beck do it again at Skeleton Coast Uranium (“SKEL”)?
The story of Uramin, Extract Resources and a new massive uranium land package. Mike Beck is a veteran natural resources investor with a track record of billion‑dollar wins in uranium and battery metals. In 2005, he co-founded UraMin, brining together uranium assets across Africa for about US$4 million — then sold the company to Areva in 2007 for US$2.5 billion at the peak of the uranium bull market. Mike then shortly after invested in an Australian company called Extract Resources which was sold for $2.2 billion.
For 15 years, Mike Beck then kept a low profile — until now.
Now, he’s making a new move back into Namibia with Skeleton Coast Uranium Corp, and talks us through why he sees now as a new, big opportunity in the uranium junior mining industry.