- HSBC warns of a commodity “super-squeeze” as copper traded near US$13,832 per tonne in early June 2026, close to its mid-May record of US$14,153 per tonne
- total copper demand expected to rise from 26.7 million tonnes in 2024 to 31.3 million tonnes by 2030, before reaching 34.1 million tonnes by 2040
- US private data-center construction reached an annualized US$50.706 billion in April 2026, while the IEA expects data-center electricity use to roughly double by 2030
- supply is not keeping pace with warnings current copper project pipeline could leave a 30% copper supply deficit by 2035
- exploration fell to a record-low 21% of global exploration budgets in 2025, while copper discoveries still take about 17 years to reach production
Copper is facing a “super squeeze” — its demand stack is deepening, just as the supply pipeline tightens.
According to HSBC Holdings Plc the squeeze for copper (and other raw materials) is being driven by the closure of the Strait of Hormuz and mine disruptions, colliding with rising consumption across data centers, electrification, and the defence industry.
“The longer the strait is closed, the more inventories are run down, the more likely it is that we reach ‘tipping points’ in the markets for some commodities,” say HSBC analysts in their report published June 1 report.
The warning comes after the copper price hit an all time high above US$14,000 in May 2026, and Goldman Sachs raises its copper forecasts and cut its 2026 mine-supply outlook by 350,000 tonnes.
By 2035, copper is expected to face a major supply deficit of 30%.
")
")
While semiconductors and chips capture headlines, the real constraint is raw materials — the copper in powerstations, transformers, switchgear, and cables that determine how much of the new AI and defence build-out can actually be realized — this is the physical bottleneck.
Coppers bull case broadens
Copper prices have traditionally been driven heavily by construction and manufacturing (especially over the last 30 years as demand from construction in China soared). Yet, China’s net imports of refined copper slumped to 125,350 tons in February 2026, the lowest monthly tally since April 2011.
So, even if supply is facing disruptions, why is the copper price still rising? The reason is the demand stack is deepening across:
- AI data centers
- electrication (and the energy transition)
- electric vehicles
- defence industrial capacity
- re-industrialisation
")
AI data centers
AI has turned data centers into one of the most important new signals for copper.
Hyperscaler AI data centers, such as those built to house Nvidia’s HGX systems, can use up to 50,000 tons of copper per facility (vs 5,000-15,000 tons of copper for a conventional data center). BHP estimates copper used in data centers could increase from about 500,000 tonnes a year today to 3 million tonnes by 2050.
Spending on US data-center construction has overtaken conventional office building, with the latest US Census Bureau data showing private data-center construction reached a seasonally adjusted annual rate of US$50.706 billion in April 2026, up 28.1% year-on-year. And this figure captures buildings, not the full mineral footprint of servers, chips, switchgear, backup power, cooling and grid connections.
")
How high can this go?
McKinsey estimates, global spending on data centers could reach US$7 trillion by 2030, but lead times in North America for critical equipment such as medium-voltage switchgear and transformers can now reach 80 weeks and 50 weeks, respectively.
S&P Global projects a surge in demand from 28 million metric tons in 2025 to 42 million metric tons by 2040, a staggering 50% increase, that means a potential 10 million metric ton copper shortfall by 2040 without meaningful supply expansion.
The US has more than 3,000 operating data centers and over 1,500 in development. Importantly, most planned projects are moving into rural areas, which means AI demand is not just concentrated in existing digital hubs, but moving into areas that need substations, transformers, transmission upgrades and copper-heavy grid equipment.
Electric vehicles and energy transition
AI may be the latest layer on the stack, but the electrification and energy transition theme remains copper intensive.
Electric car sales grew by 20% globally to exceed 20 million in 2025, meaning one-quarter of all new cars sold were electric. This matters for copper as an battery-electric car requires 183 lbs of copper, x3.6 the intensity of internal-combustion models.
By 2030, BloombergNEF forecasts global passenger EV sales will reach 39 million vehicles , equal to 42% of all new car sales globally. At roughly 183 lbs of copper per electric vehicle , that would require about 3.2 million tonnes of copper — a significant draw in a global refined copper market of nearly 27 million tonnes in 2024.
")
And, despite our skepticism towards net zero targets and some of the more outlandish projections for the energy transition, the closure of the Strait of Hormuz and rising energy prices has reignited demand for alternative energy supply.
And copper is the most important mineral for almost all renewable energy; for example, solar capacity additions in 2040 are expected to be triple those of 2020, resulting in a near tripling of copper demand from solar PV; and offshore wind requiring greater cabling, will mean copper demand could reach 600 kt per year in 2040.
")
Construction and re-Industrialisation
Equipment manufacturing, followed by construction and infrastructure, are still the largest end-uses for copper — and, efforts by the West to (re-) industrialise and urbanisation across Asia and India, are also helping to offset falling copper consumption in China.
For example, in 2024, total US copper use increased across nearly all sectors:
- electrical equipment and electronics: up 4%, showing copper’s expanding role in power systems and advanced technologies
- industrial machinery: up 5%, driven by modernization and automation trends
- building construction: up 3%, supported by home electrification and renewable-ready infrastructure
Core economic demand globally is forecast to increase by 2% annually, from 18 million metric tons in 2025 to 23 million metric tons by 2040. For example:
")
Defence industry
Estimating copper demand from global militaries and defence systems is challenging due to national security restrictions on disclosure, but as defence budgets and geopolitical instablity increases, so too does copper demand.
“Rising defence budgets are creating a quiet but meaningful source of incremental copper demand,” says Peter Schmitz at Wood Mackenzie.
To give an impression of defence demand, as we estimate in a previous newsletter, Russia’s 11 million shells fired against Ukraine in 2022 contain same amount of copper as 10% of UK’s total wind turbine capacity.
But it’s not just shells, but missiles to increased naval capacity. And, as world military expenditure reached US$2887 billion in 2025, an increase of 2.9% in real terms over 2024, so to copper demand is expected to increase proportionately.
Short-term supply struggles
The challenge is that supply is struggling to keep up, with both long-term structural isues and significant immediate-term disruption, with Goldman Sachs cutting its 2026 global mine supply forecast by 350,000 tonnes:
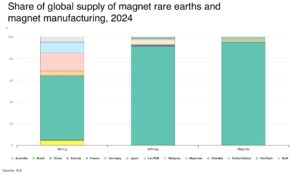
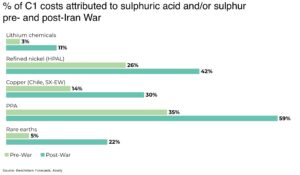
- the closure of hte Strait of Hormuz means diesel and sulphuric acid (used in processing about one-sixth of the world’s copper) supply shocks are raising mine operating risks and costs — and, as HSBC warns, could represent an acute shock to supply
- a reported delay to the restart of Freeport Indonesia’s Grasberg Block Cave copper mine into early 2028
- a fatal tunnel collapse at Codelco’s flagship El Teniente mine forced the Chilean state copper producer to cut its 2025 production guidance to 1.34-1.37 million tonnes, down from 1.37-1.40 million tonnes
- significant downward guidance revisions of copper output at mines operated by Ivanhoe and Teck
- average copper grades have fallen from 1.02% in 2022 to 0.66% in 2025 across the Codelco (the state-owned mine and largest copper producer in the world) aging portfolio; output from the world’s third-largest copper producer saw a sharp 12% year-on-year decline in 2025 in Peru
Exploration is the big bottleneck
The long-term crisis in copper supply is the structural weakness: the copper industry is simply not finding and building enough future mines to manage any short-term disruption and incoming demand.
S&P Global says 162 of 258 major copper discoveries made between 1990 and 2024 remain undeveloped, 134 have not completed feasibility studies, and only 17 have reached construction. It also estimates global copper mine supply, including operating mines and pipeline projects, could peak at 27.3 million tonnes in 2030, then decline to 25.1 million tonnes in 2035. The IEA makes a similar point: only 5% of copper deposits discovered in the last 35 years were found in the last decade.
Yet, exploration capital is not yet behaving as if this is an emergency.
S&P Global’s 2026 exploration trends report says the global nonferrous exploration budget slipped to US$12.4 billion in 2025 and grassroots exploration fell to a record-low 21% share of global budgets. For copper, grassroots work accounted for only 25% of base-metals exploration budgets in both 2024 and 2025.
And, even if exploration trends were higher, with an average timeline of approximately 17 years from discovery to production of copper mines — and even longer for projects initiated after 2025 — it would still take decades before the supply pipeline increases.
")
This is where the juniors move back into focus — the next supply cycle has to start with discovery, drilling, permitting and feasibility work long before the market needs the tonnes. So tomorrow’s copper supply starts with today’s exploration budget.
Generation Mining shows how the thesis moves from discovery to supply
Generation Mining (TSX: GENM | OTCQB: GENMF) is advancing the Marathon project, a large, shovel-ready copper-palladium deposit in Canada’s Ontario province. Construction is expected to begin later in 2026 — after receiving approval for CAD$200 million subordinated debt facility by the Canada Infrastructure Bank to support the construction and development of the project.
Copper accounts for 47% of Marathon’s payable metal revenue at recent spot prices, and 34% in the base case in the company’s Marathon feasibility study, updated in March 2025, that provides three mix cases:
| Price case | Copper price | Palladium price | Copper share of payable metal revenue | Palladium share |
| Base case | US$4.02/lb | US$1,523/oz | 34% | 52% |
| Spot pricing | US$6.50/lb | US$1,300/oz | 47% | 38% |
The project is one of the few fully permitted critical-mineral projects in North America, with a 2025 feasibility study outlining an after-tax NPV6% of C$1.07 billion, a 28% IRR and a 1.9-year payback period. Average annual payable production is projected at 42 million lbs of copper, 168,000 oz of palladium and 38,000 oz of platinum over an approximately 13-year mine life.
That puts Generation Mining in the part of the Lassonde curve the copper market may soon start to value more aggressively: past discovery and permitting, but before the production cash flow begins.
Importantly, the project is in northwestern Ontario, Canada’s top-rated mining jurisdiction, and the second highest ranking in the world, with established infrastructure, close to the Trans-Canada Highway, as well as power and regional transport infrastructure, and, of course, the town of Marathon
As the company moves toward a fully financed construction decision, there appears to be considerable re-rating potential, with strong leverage to higher copper prices.
Conclusion
Copper’s bull case is resilient because the demand stack has deepened — and, just as important — the new demand drivers are increasingly price resilient:
Unlike other sectors where high input costs might take a bite out of demand, data center developers are largely indifferent to copper prices. According to Wood Mackenzie (WoodMac), the metal accounts for less than 0.50% of total project costs, which is little more than a rounding error in an industry that is considered a national security priority.
In other words, high prices is unlikely to stand in the way of demand. Data centers will be built whether copper is trading at US$10,000 or US$20,000.
That puts copper explorers, developers and high-quality juniors back into the frame. The next mine does not start when the market finally wants copper. It starts years earlier, when capital is still willing to fund discovery.
If AI is the new demand shock, critical minerals are the physical chokepoint. And copper is one of the clearest tests of whether the world can build the power economy it is now promising.
Q&A
Why is copper demand rising?
Copper demand is rising because grids, EVs, construction, industry and data centres are all expanding, with the IEA projecting total demand reaching 34.1 million tonnes by 2040.
How does AI affect copper demand?
AI increases copper demand through data centers, power distribution, cooling systems and grid connections; BHP estimates data center copper use could rise to 3 million tonnes a year by 2050.
Is copper heading for a deficit?
The IEA says the current project pipeline could leave copper with a 30% supply deficit by 2035.
Why do junior copper explorers matter?
Junior explorers matter because S&P Global estimates copper mines take about 17 years from discovery to production, making today’s exploration the start of tomorrow’s supply.