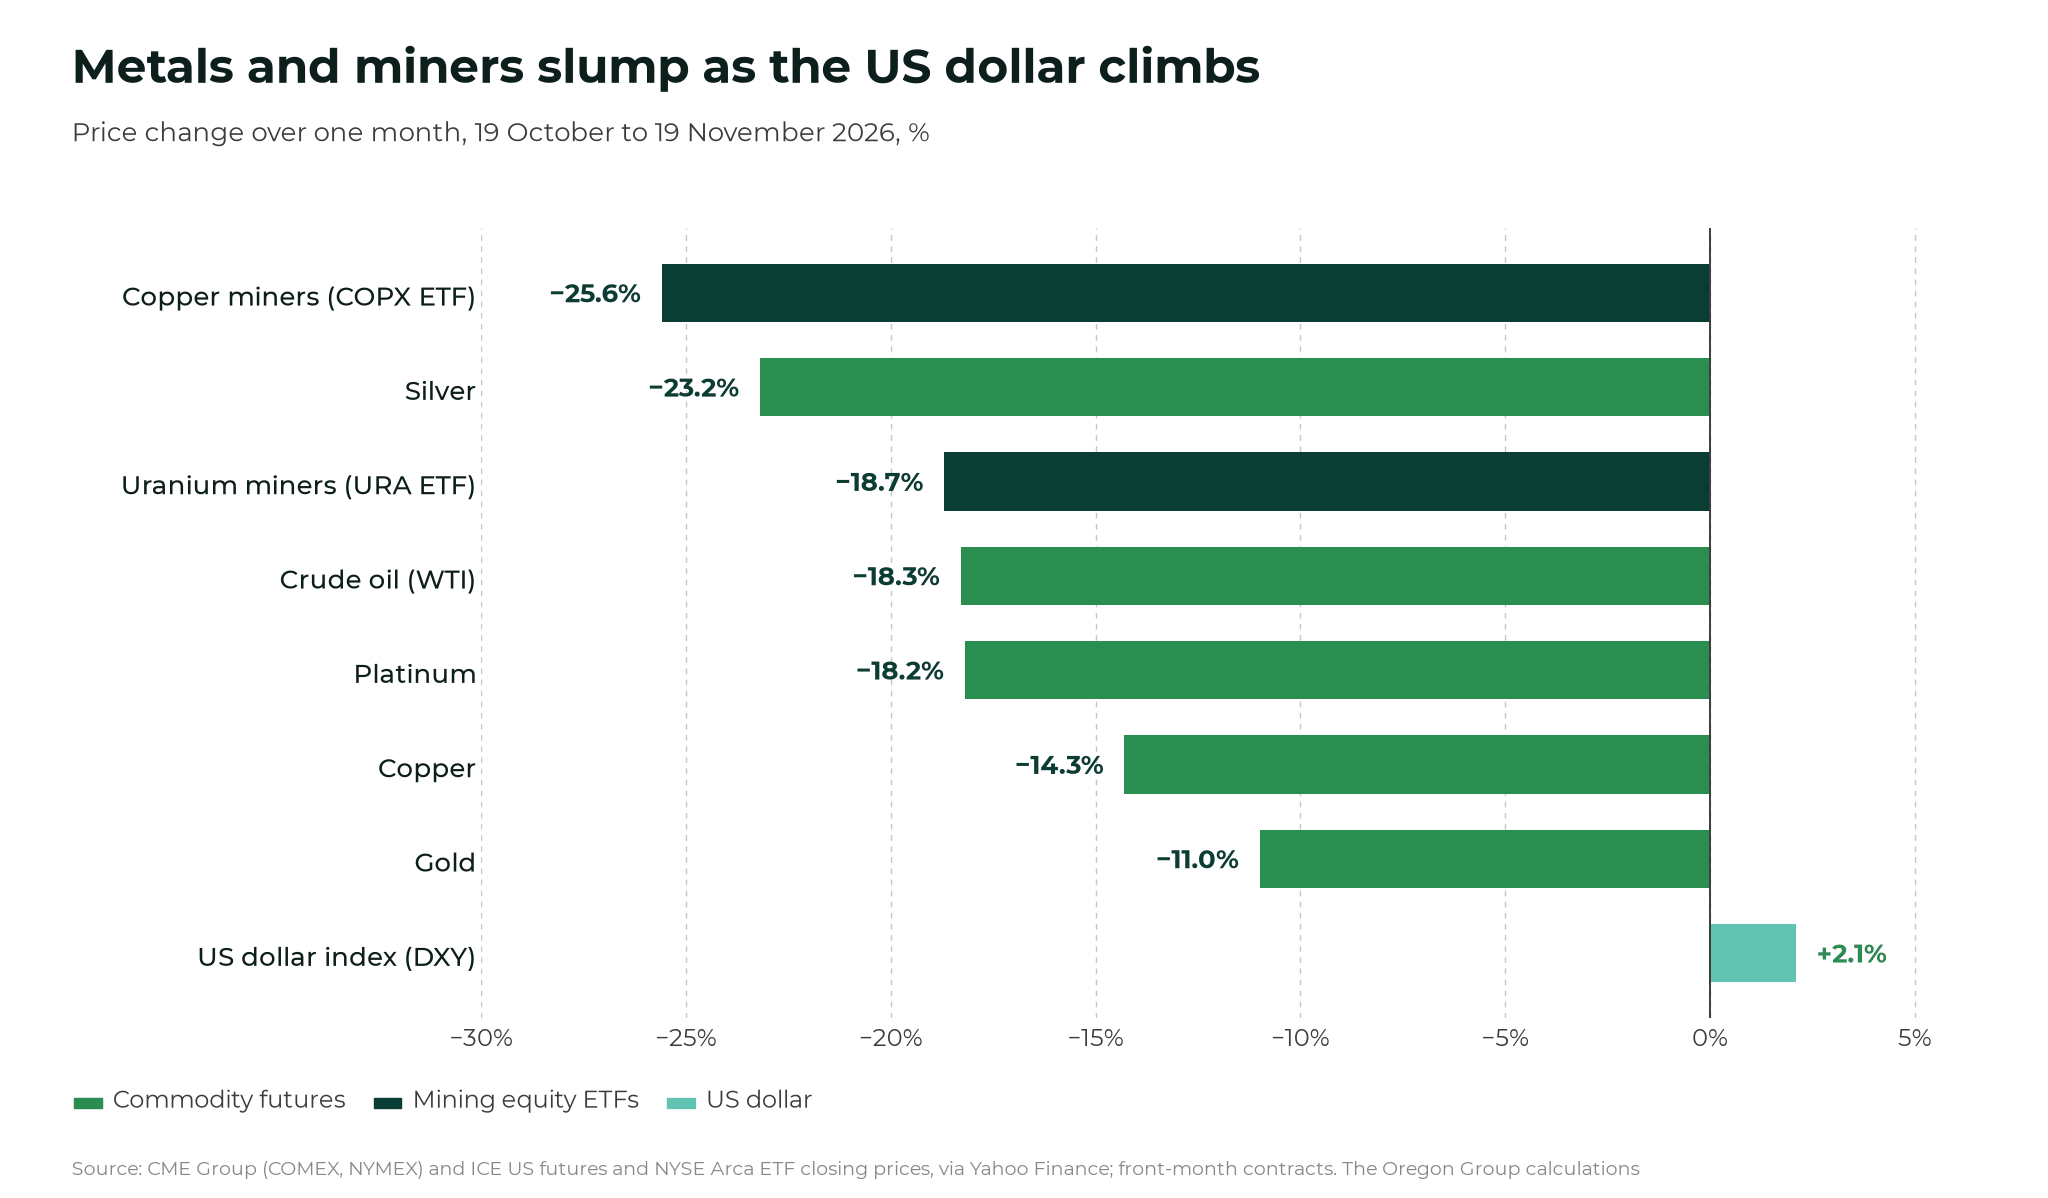
- the Bloomberg Commodity Total Return Index, a broad basket of commodity futures, fell 8.2% in the first 18 days of November, as copper, gold, silver and oil all sold off on expectations of another US interest rate rise
- the 11 biggest copper-exposed miners have lost US$186 billion, or 20% of their value, in a month, pushing BHP and Rio Tinto into a bear market, meaning a fall of 20% or more from their recent peak
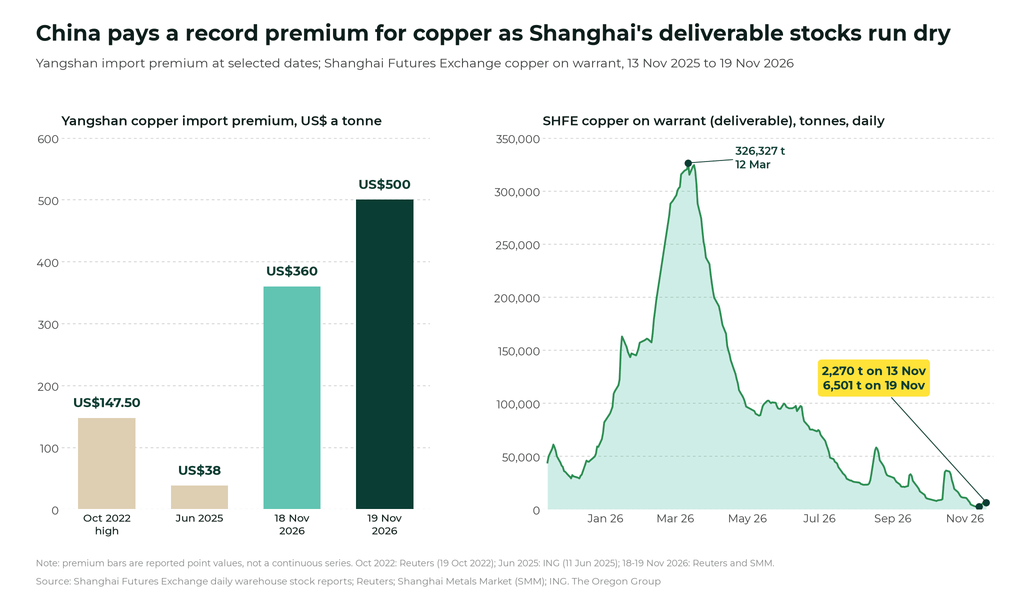
- the selling is mostly financial: China is paying a record US$500 a tonne premium to import physical copper, up from less than US$100 in September
Commodity markets have had a brutal November, with the Bloomberg Commodity Total Return Index down 8.2% in the first 18 days of the month as a strong US dollar and bets on higher US interest rates drive investors out of metals and energy.
The selling has been broad:
- copper fell to its lowest since April this week, 19% below its September record
- silver has dropped 22% in November alone
- crude oil about 20% (as the market prices in falling demand and a potential recovery in Middle East supply)
- while gold was heading for its worst week in eight months on Friday morning, down about 8.9%
Gold is now more than a third below its record of US$5,594.82 an ounce in January. By our calculations, that fall has wiped about US$14.5 trillion off the value of the world’s 224,200 tonnes of above-ground gold.
The moves are painful for investors and miners alike — but underneath the price the picture is less gloomy than the headlines suggest.
What is driving the commodity sell-off?
The biggest single driver is the US Federal Reserve (the Fed), America’s central bank, which is preparing to raise interest rates again rather than cut them.
The Fed raised rates by a quarter point in September to a range of 3.75% to 4%, and two officials voted for another rise in October.
Then US consumer prices rose 0.4% in October, more than expected, after annual inflation hit 3.7% in September, well above the Fed’s 2% target.
Markets now put a 97.3% chance on a quarter-point rise at the Fed’s 8-9 December meeting, according to CME Group’s FedWatch tool, and traders are pricing another rise in January.
The tone from Fed officials is hawkish, meaning they favour tighter policy. Philadelphia Fed President Anna Paulson said this week the central bank needs to raise rates further, while Governor Christopher Waller has said a half-point rise may be needed to “shock people”.
Higher rates hurt commodities in two ways:
- they make it more expensive to hold metals that pay no interest
- and they pull money into the US dollar
The US dollar index (DXY), which measures the dollar against six major currencies, has climbed to about 103.9, its strongest since April 2025 — and, because most commodities are priced in dollars, a stronger dollar makes them more expensive for buyers in China, Europe and India.
Meanwhile, the benchmark 10-year US Treasury yield is sitting just above 5% so, in other words, investors can earn more than 5% a year from US government debt, which makes holding gold or silver a harder sell.
Recession fears and the AI unwind
The second driver is fear that growth is slowing just as borrowing costs rise.
China’s official factory index fell to 49.3 in October; any reading below 50 signals contraction. Retail sales rose just 0.4% from a year earlier and fixed-asset investment, which covers property and infrastructure, shrank 8.1% in the first ten months of the year.
At the World Copper Conference Asia in Shanghai this week, Mercuria’s head of metals research, Nicholas Snowdon, warned that copper demand is closer to “a recessionary-like environment than growth environment”.
In the US, the picture is mixed, wit the Fed itself describing the economy as expanding “at a strong pace”, but the Philadelphia Fed’s factory index fell to 6.3 in November from 20.9 and the Conference Board’s leading index dropped 0.3% in October.
Notably, billionaire investor Stanley Druckenmiller told a conference in Austin he is short copper, meaning he is betting on lower prices, and warned the second half of 2027 “could be economically disappointing”.
“We’ve had regime change at the Fed” — Stanley Druckenmiller
The third driver is the unwinding of the artificial intelligence (AI) trade. Copper became a proxy for data-centre spending, and investors have pulled back after the US midterm results dented optimism about AI spending and regulation by the Democrats, as well as Nvidia chief executive Jensen Huang’s exit rattling the sector.
Funds sold harder than the metal
However, much of the fall has come from speculators rather than the companies that actually use copper.
Saxo Bank’s head of commodity strategy, Ole Hansen, put it plainly:
“AI was a trigger, but it’s not really the driver”
Ole Hansen, Saxo Bank
Money managers have cut their net bets on higher New York copper prices from more than 80,000 contracts six weeks ago to about 35,000, close to a 14-month low, while trend-following funds sold as key price levels broke.
Mining shares have fallen even harder than the metal. For example, Southern Copper is down 26% in a month, Ivanhoe Mines 34%, and BHP’s market value has dropped by US$32 billion to US$178 billion.
The physical copper market tells a different story
But, here’s the contradiction: while funds dump copper futures, Chinese buyers are paying more than ever for metal they can actually take delivery of.
The Yangshan premium, the extra price paid to import copper into China, hit a record US$500 a tonne on 19 November, up almost 40% in a day. Copper stocks in Shanghai Futures Exchange warehouses have fallen to 27,642 tonnes, the lowest since December 2023.
The squeeze is tighter than the warehouse total suggests as,oOf the 27,642 tonnes of copper in Shanghai Futures Exchange warehouses on 13 November, just 2,270 tonnes were on warrant, meaning registered and available for delivery against futures contracts. On-warrant stocks stood at 6,501 tonnes on 19 November, down 98% from 326,327 tonnes in March.
The last big spike in China’s import premium, in October 2022, topped out at US$147.50 a tonne; this week’s US$500 is more than three times that. Spikes like this can, of course, reverse fast, though: in 2025 the premium fell from above US$100 to US$38 within a month once Chinese buying cooled.
Smelters are also short of raw material.
Spot treatment charges, the fee miners pay smelters to process their concentrate, sank to a record minus US$247.20 a tonne on 6 November. In other words, smelters are paying miners for ore.
Supply is not keeping up either as Chile’s copper commission, Cochilco, expects the world’s biggest producer to mine 4.94 million metric tonnes this year, its lowest in 23 years, as we reported when Chile’s copper output fell 15%.
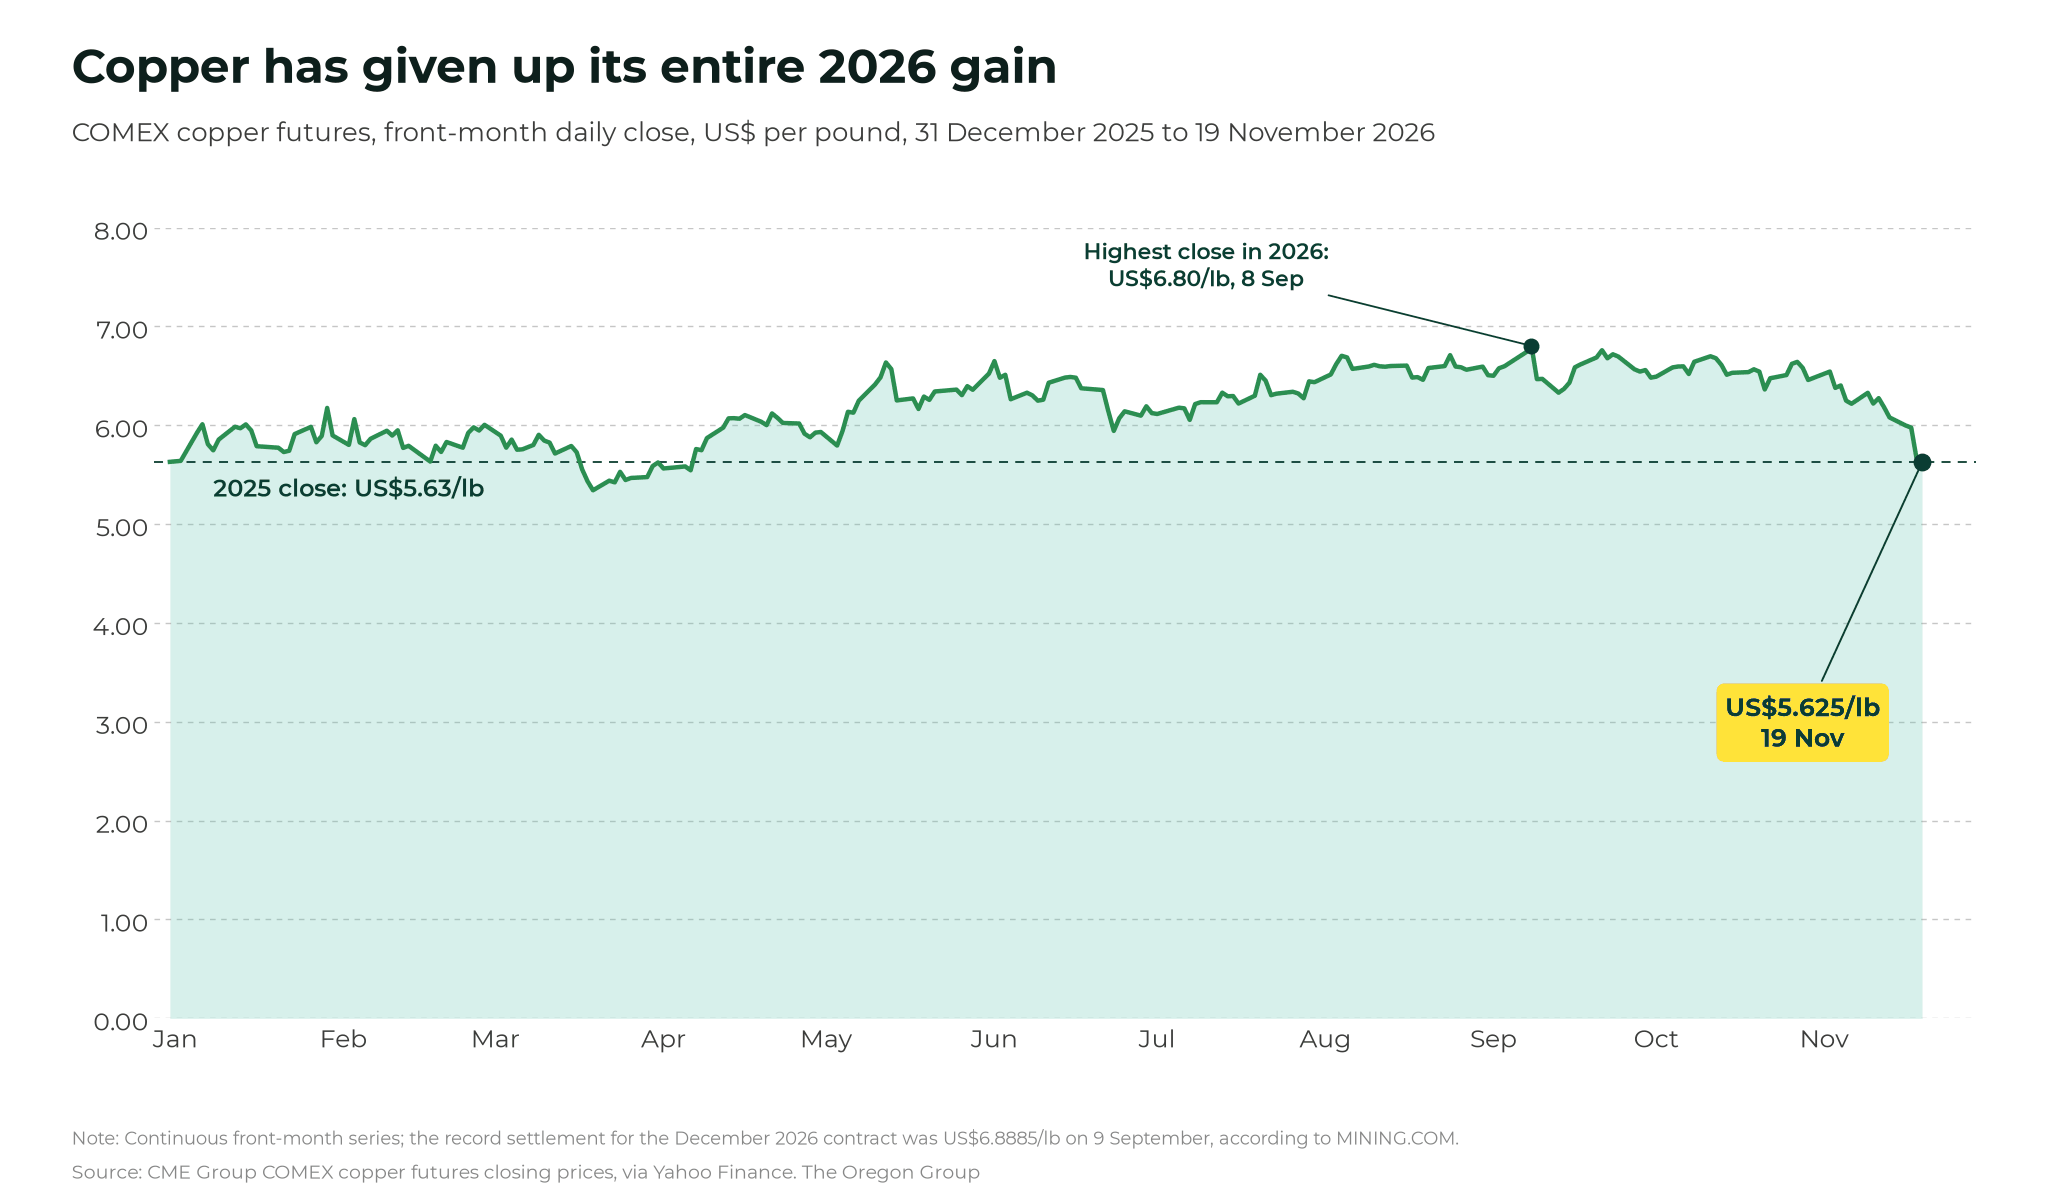
There is a catch. The International Copper Study Group forecasts a refined copper surplus of about 104,000 tonnes in 2026, widening to 368,000 tonnes in 2027, and roughly 85% of the 1.09 million tonnes of exchange-monitored copper sits in the US, stockpiled ahead of possible tariffs.
If that metal flows to China, the premium could fall quickly. Basically, the shortage is in concentrate and in China, not in every warehouse, a distinction we drew in our analysis of the refined copper surplus.
Why the picture is better than the price
The sell-off also brings some relief, and some support, that tends to get lost in a falling market. For example:
- cost relief: the US average diesel price fell below US$6 a gallon in the week to 16 November for the first time since mid-September, easing one of miners’ biggest operating costs after the diesel squeeze we flagged in August
- a weaker home currency for producers: the Australian dollar has fallen from 70 US cents to 67 since the end of October, which cushions Australian miners’ margins because they sell in US dollars but pay most costs at home
- central banks are buying gold: official buyers added 321 tonnes of gold in the third quarter, up 42% on a year earlier, led by China and Poland
- uranium is holding up: the uranium spot price eased only to US$90 a pound, with the long-term contract indicator at US$99, even as uranium shares sold off, a gap we explored in uranium’s sell-off and its tightening supply outlook
History offers some comfort too. During the pandemic sell-off copper fell to US$4,371 a tonne in March 2020, then hit a record US$10,747.50 just 14 months later.
That is no guarantee of a repeat, but in our view sell-offs driven by funds and interest rates, rather than by mines producing too much, tend to give long-term investors better entry points than they take away.
The risks to watch
The Fed meets on 8-9 December, and a half-point rise would add pressure to commodities — and for copper a proposed 15% US tariff on refined copper from 2027 still remains undecided, but if it is dropped, US stockpiles could flood back into the market.
The sell-off has repriced commodities for higher interest rates, but it has not fixed the shortage of copper concentrate or the slide in global supply, nor dented central banks’ appetite for gold, or the impact of AI and data centers on critical mineral demand — and those are the forces that will set prices once the selling stops.