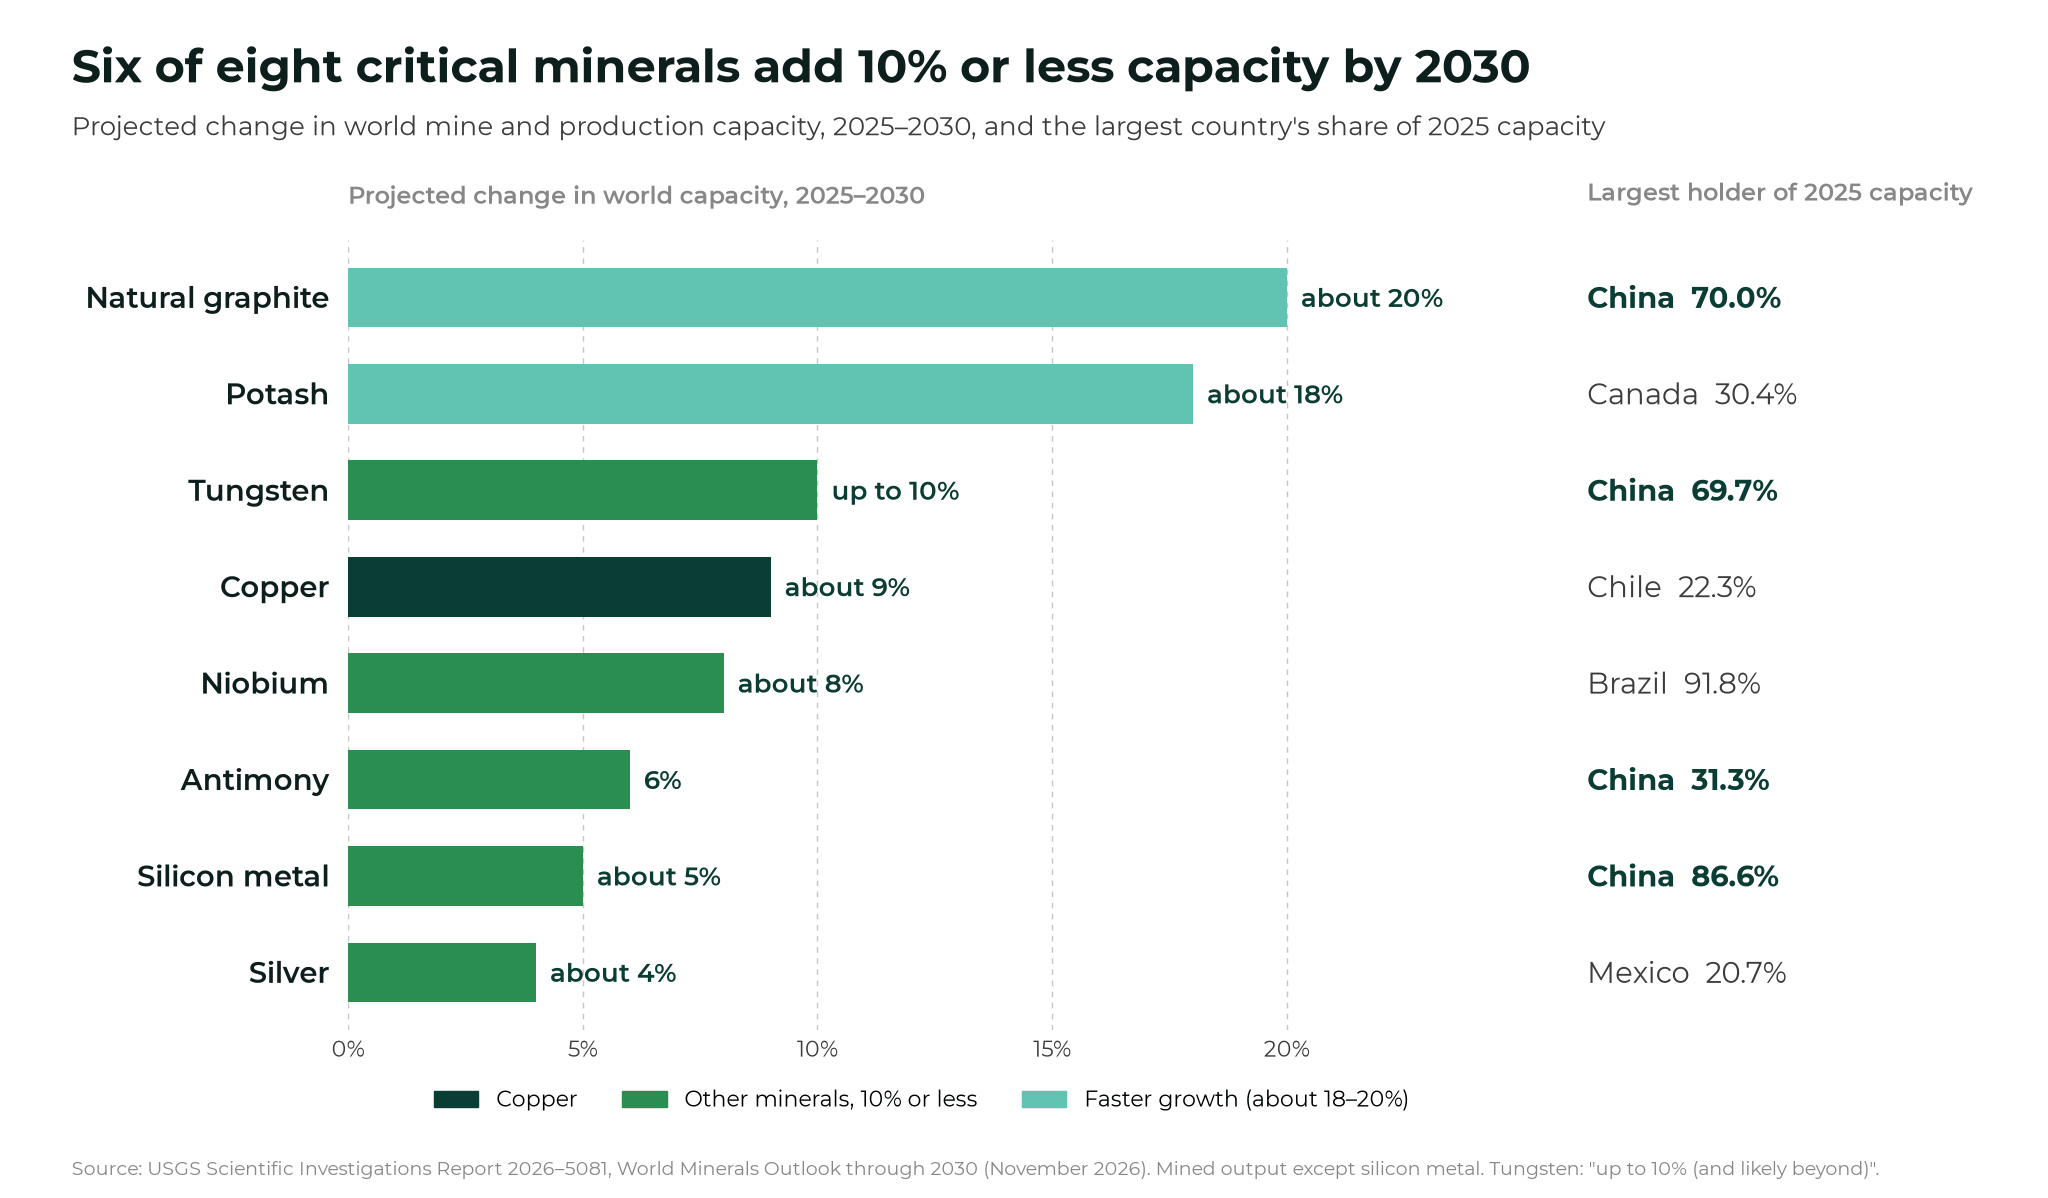
- world capacity to mine or produce six of the eight critical minerals in a new US Geological Survey outlook (antimony, copper, niobium, silicon metal, silver and tungsten) is set to grow by just 4% to 10% in total between 2025 and 2030, or under 1% to about 2% a year
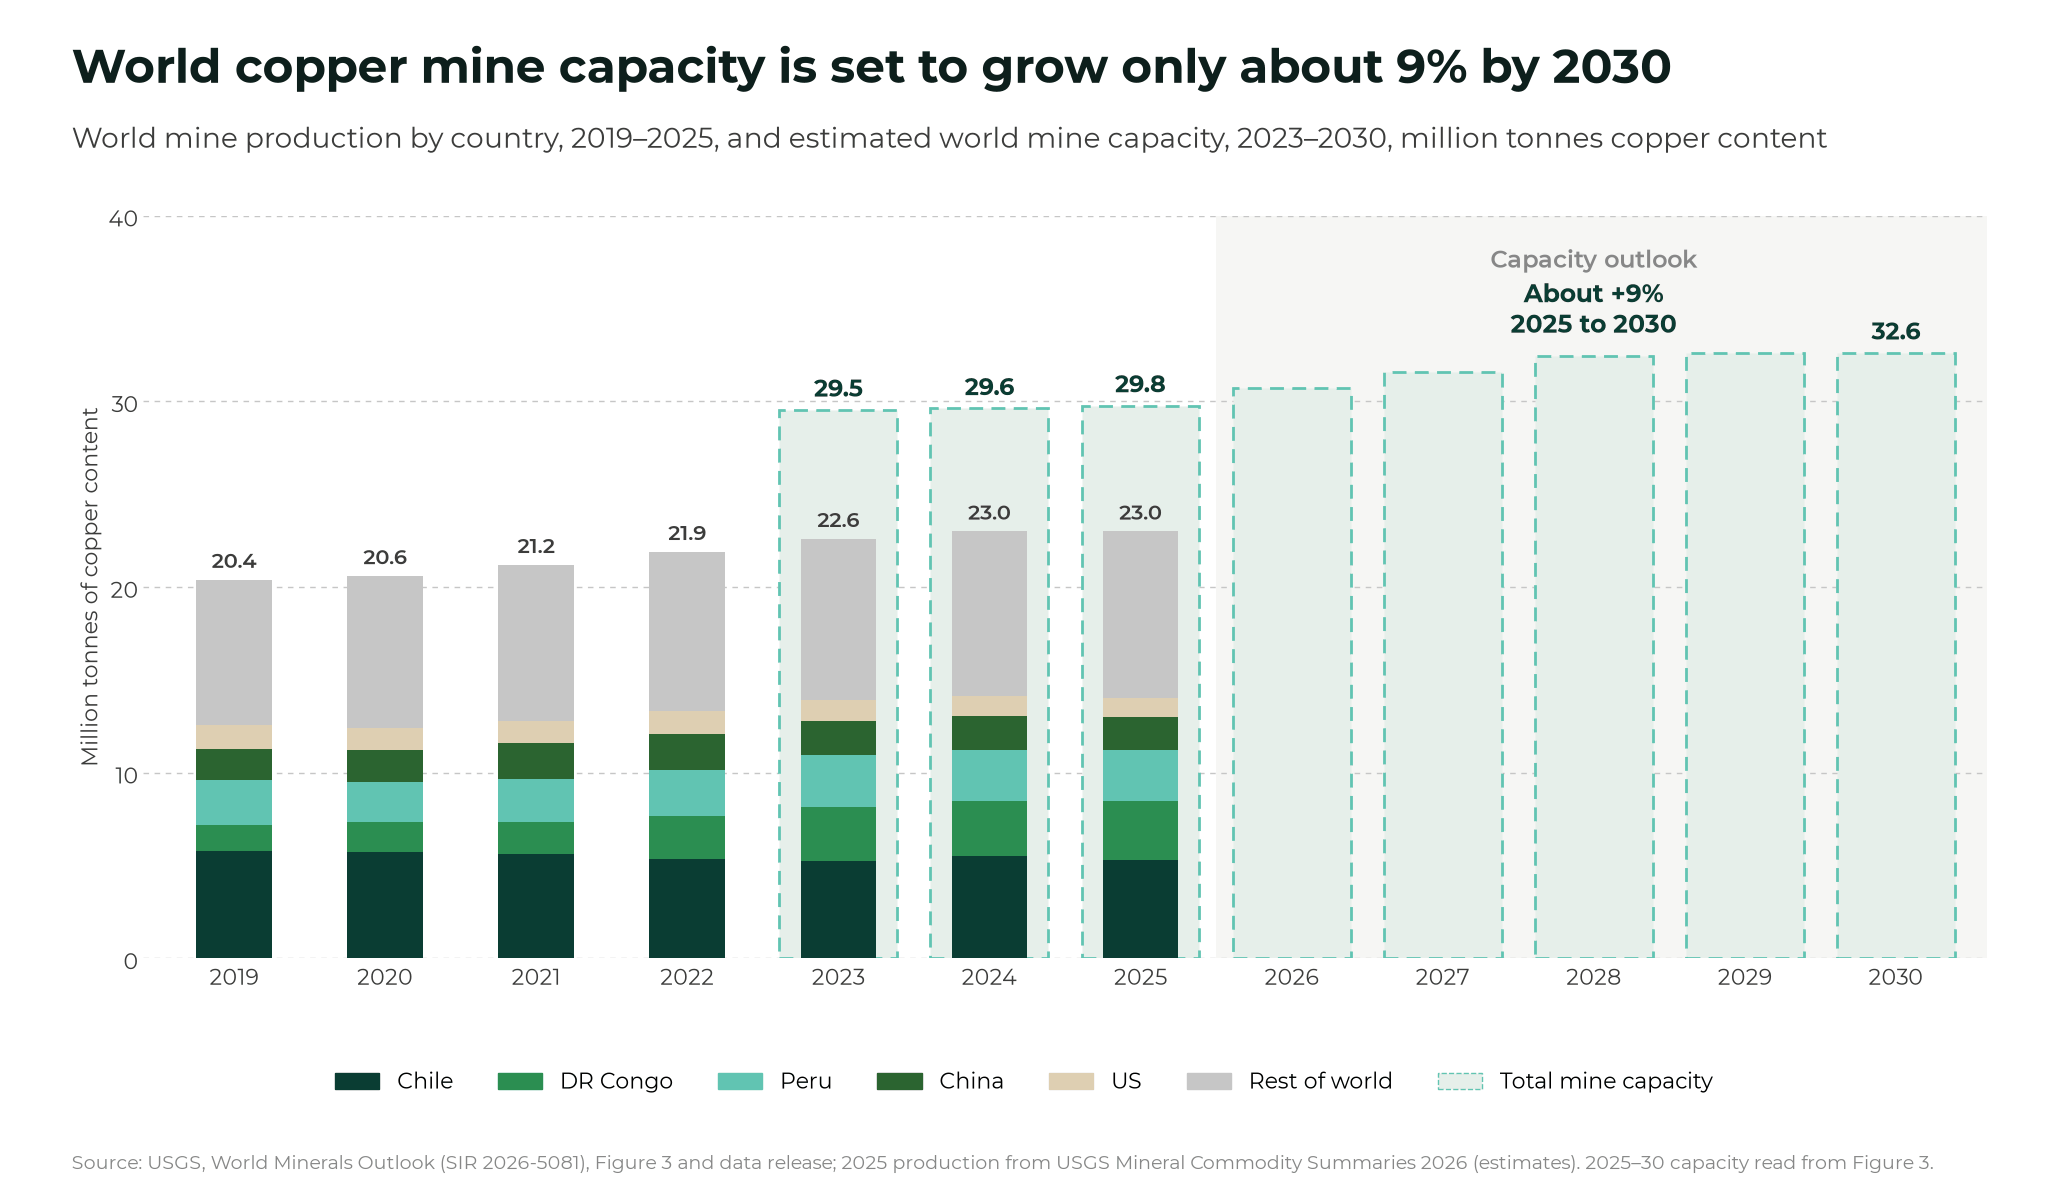
- copper mine capacity is projected to rise about 9% from nearly 30 million tonnes in 2025, compared with a 12% rise in world copper mine output over the previous five years, while BloombergNEF expects a copper deficit from 2028
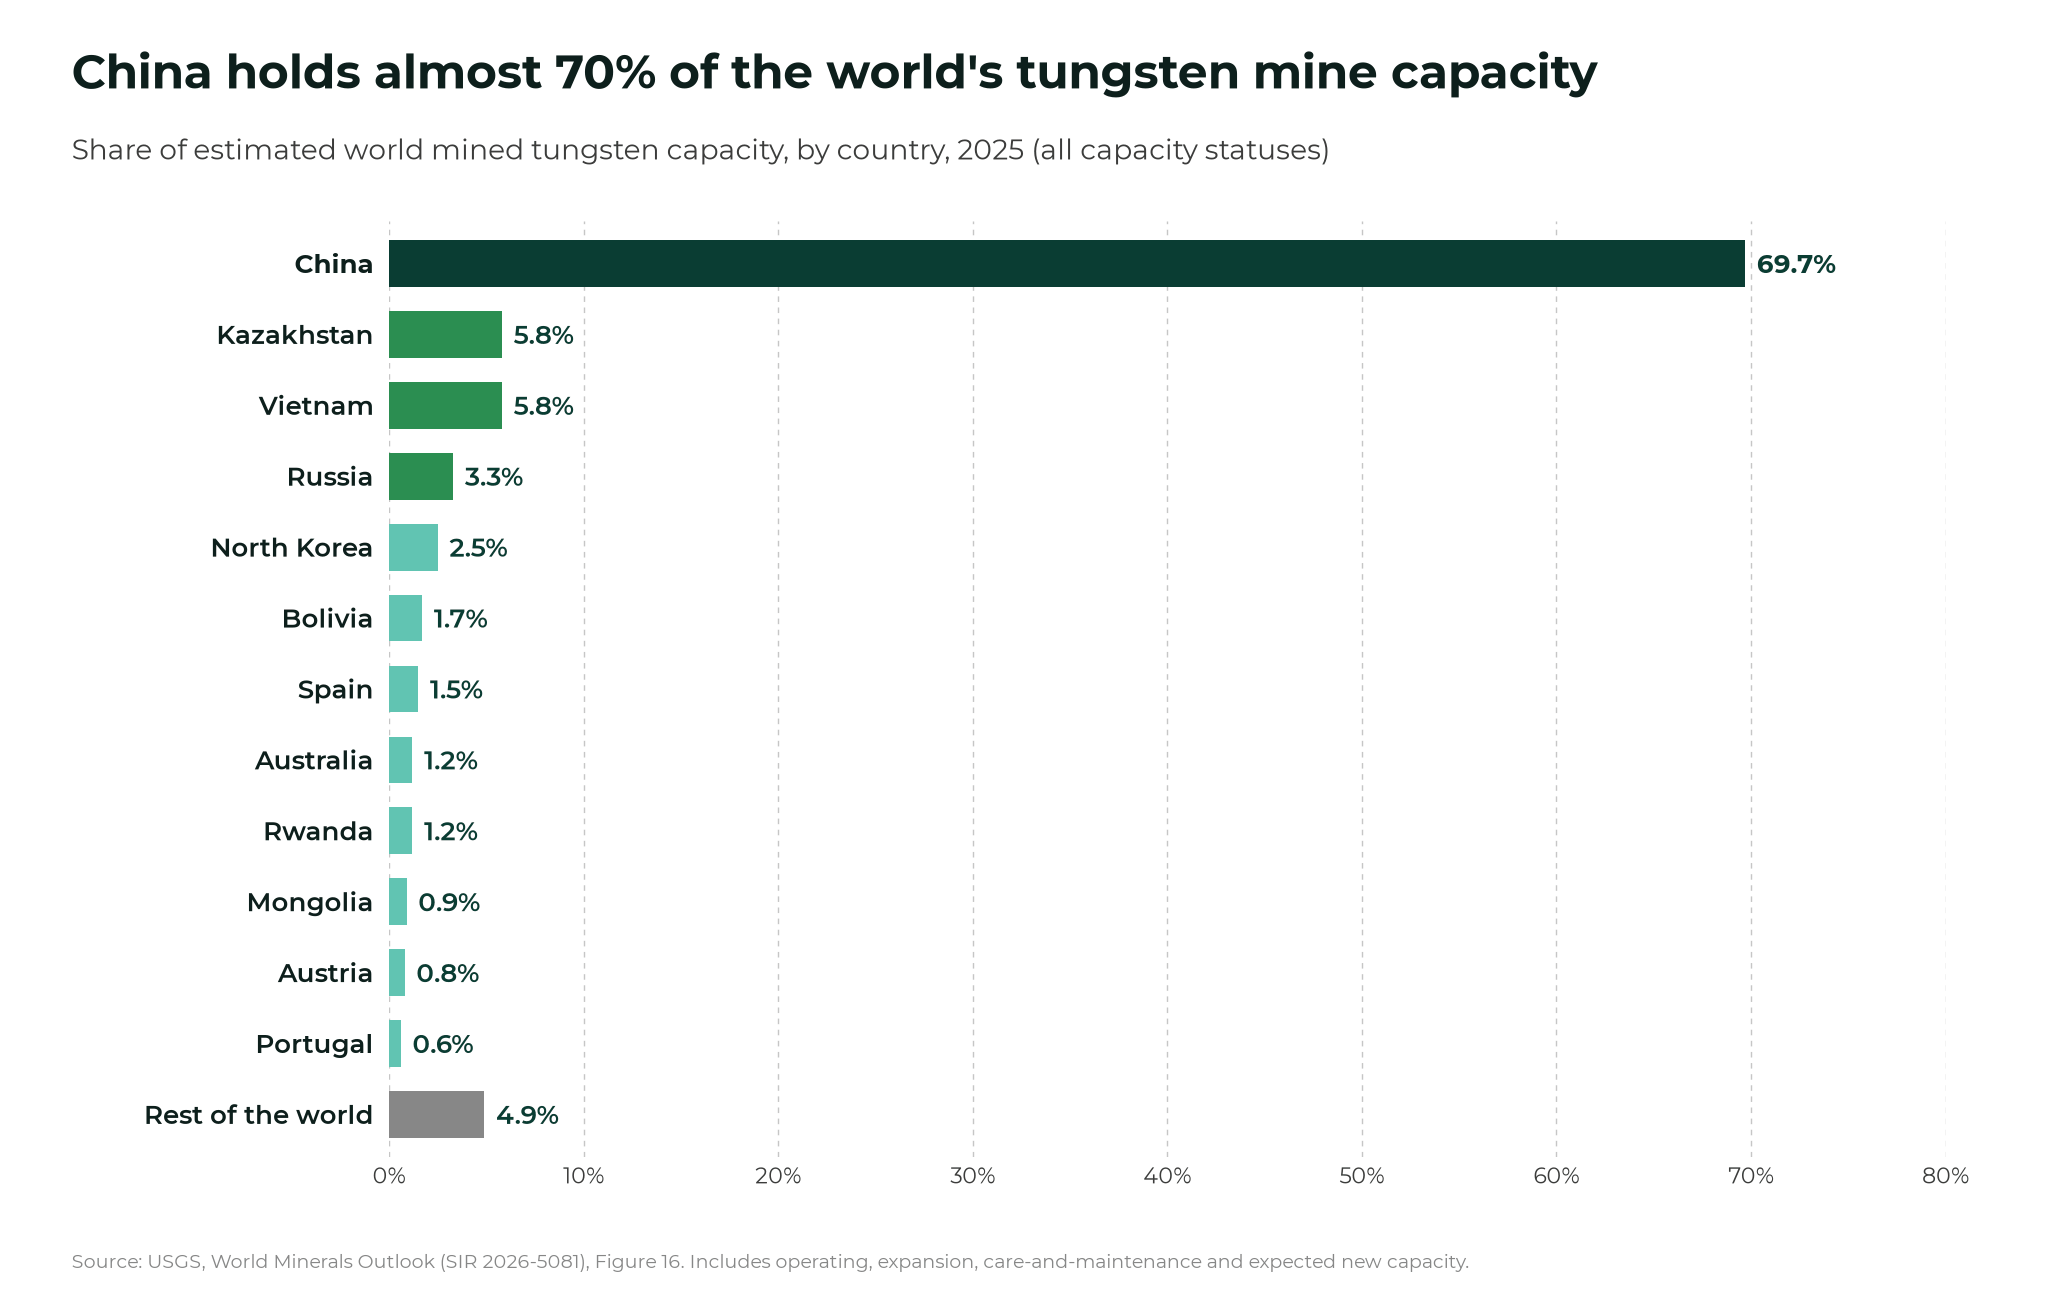
- China holds about 70% of 2025 capacity for natural graphite and tungsten and 87% for silicon metal, while Brazil holds 92% of niobium
- only natural graphite and potash grow faster, by about 18% to 20%, but graphite mines used just 45% of their capacity in 2025 as Chinese producers ran at a loss to hold market share
World capacity to mine or produce six of eight critical minerals, including copper, tungsten and antimony, will grow by just 4% to 10% between 2025 and 2030, according to a new US Geological Survey (USGS) outlook.
That is the total over five years, or under 1% to about 2% a year. The six minerals include:
- copper
- tungsten
- antimony
- niobium
- silicon metal
- silver
Only natural graphite and potash are expected to grow faster, by about 18% to 20%.
The World Minerals Outlook covers eight minerals on the 2025 US critical minerals list, and the US depends on imports for more than half of its consumption of each one.
In contrast to the latest projections, world copper mine output rose about 12% in the five years to 2025, from 20.6 million tonnes in 2020 to an estimated 23 million tonnes, and silver output rose about 11%, from 23,500 tonnes to 26,000 tonnes. Output and capacity are different measures, but the USGS now expects capacity for the two metals to grow by only about 9% and 4%.
Copper adds less than 2% a year
Copper mine capacity was nearly 30 million tonnes in 2025, with Chile, the Democratic Republic of the Congo, Peru, China and the US holding 59% of it. It barely moved from 29.5 million tonnes in 2023 to 29.6 million tonnes in 2024 and is set to rise about 9% by 2030.
The challenge is that demand is moving faster that projected supply.
BloombergNEF forecasts a copper deficit from 2028 and demand up 61% between 2026 and 2050, while the USGS points to falling ore grades, rising capital costs and long permitting timelines holding back new mines.
As we reported in our earlier article on the US$360 billion of new copper mines the world needs by 2050:
“new mines take an average of 17 years to come into operation, so the shortfall could persist for decades”
China holds the capacity for graphite, silicon and tungsten
Supply of the other minerals is also heavily concentrated, with China holding 70% of natural graphite capacity, 87% of silicon metal and 69% of tungsten, while Brazil holding 92% of niobium.
The example of tungsten shows what such concentration can means for prices: after China put new export controls on some tungsten products in February 2025, prices for tungsten concentrate and ammonium paratungstate, a key tungsten intermediate, more than doubled in 2025. Close to a dozen mine projects outside China plan to start in 2028 or later.
Antimony, used in ammunition and flame retardants, faces a closer deadline. World antimony mine capacity was 192,000 tonnes in 2025 and is set to grow 6% by 2030, but US antimony metal prices more than doubled from about US$10 a pound in 2024 to US$24 in 2025 after China banned exports to the US (then spot prices fell to about US$12 a pound by the end of April 2026 after Beijing paused the ban in November 2025. That pause runs until 27 November 2026, unless China extends it, as it did on 9 November with its pause on rare earths controls.)
Graphite’s 20% growth meets idle mines
The fastest-growing mineral in the report has the opposite problem. Graphite mine capacity is set to rise about 20% by 2030, but mines used only about 45% of their capacity in 2025.
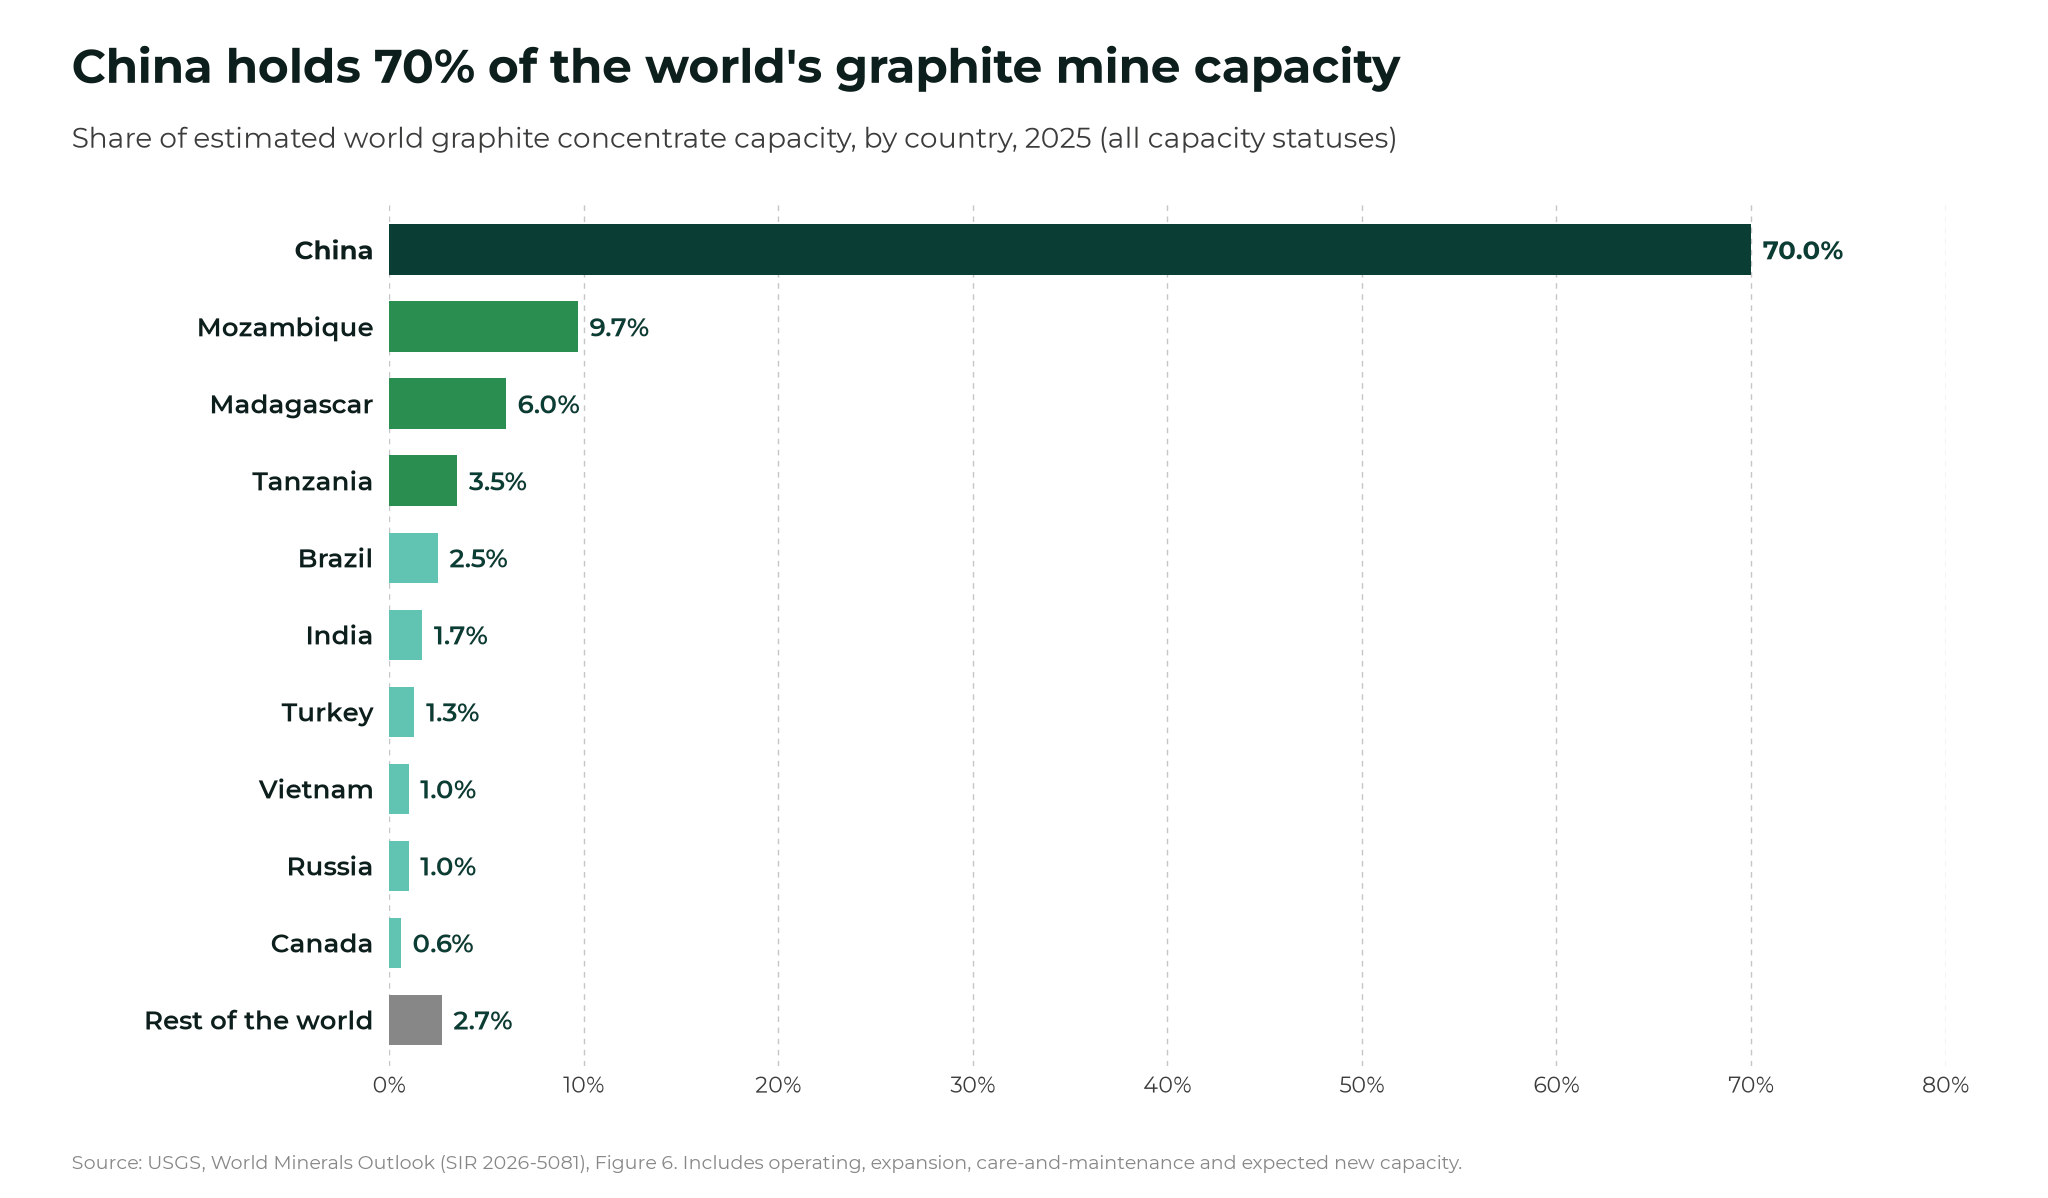
Chinese flake graphite capacity grew faster than demand in 2024 and 2025, pushing prices to multiyear lows, and some Chinese producers have run at a loss to hold their market share, with utilisation near 40%. That makes it hard for new mines outside China to compete.
The risks to watch
Capacity is not production.
US metal ore mines ran at about 56% of capacity in 2025, and the USGS says actual output will depend on prices, export controls and how fast projects start. Its tungsten figure is “up to 10 percent (and likely beyond)”.
The USGS figures show that for copper the constraint is time, and for graphite, silicon and tungsten it is China, which can add supply faster than the West can build it and restrict it just as quickly.