Critical Minerals and Energy Intelligence

World will need US$360 billion of new copper mines by 2050

  • the world will need to build 16.1 million tonnes a year of new copper mine output by 2050, at a cost of about US$360 billion, according to a Payne Institute paper published October 26
  • at baseline demand, the estimate ranges from US$304 billion at the lowest benchmark project cost to about US$545 billion if real mine costs keep rising 3.4% to 3.6% a year
  • that puts the bill above BloombergNEF’s US$332 billion estimate, which the authors say assumes mine costs 26% below the current project average


The world will need about US$360 billion of new copper mines by 2050 to meet demand, according to new research from the Payne Institute at the Colorado School of Mines.

At baseline demand, the paper puts the range at US$304 billion to about US$545 billion. The low end prices new mines at the cheapest benchmark project; the high end assumes real building costs keep rising at 3.4% to 3.6% a year.

The research comes six days after BloombergNEF put the cost of the new copper mines needed by 2050 at US$332 billion.
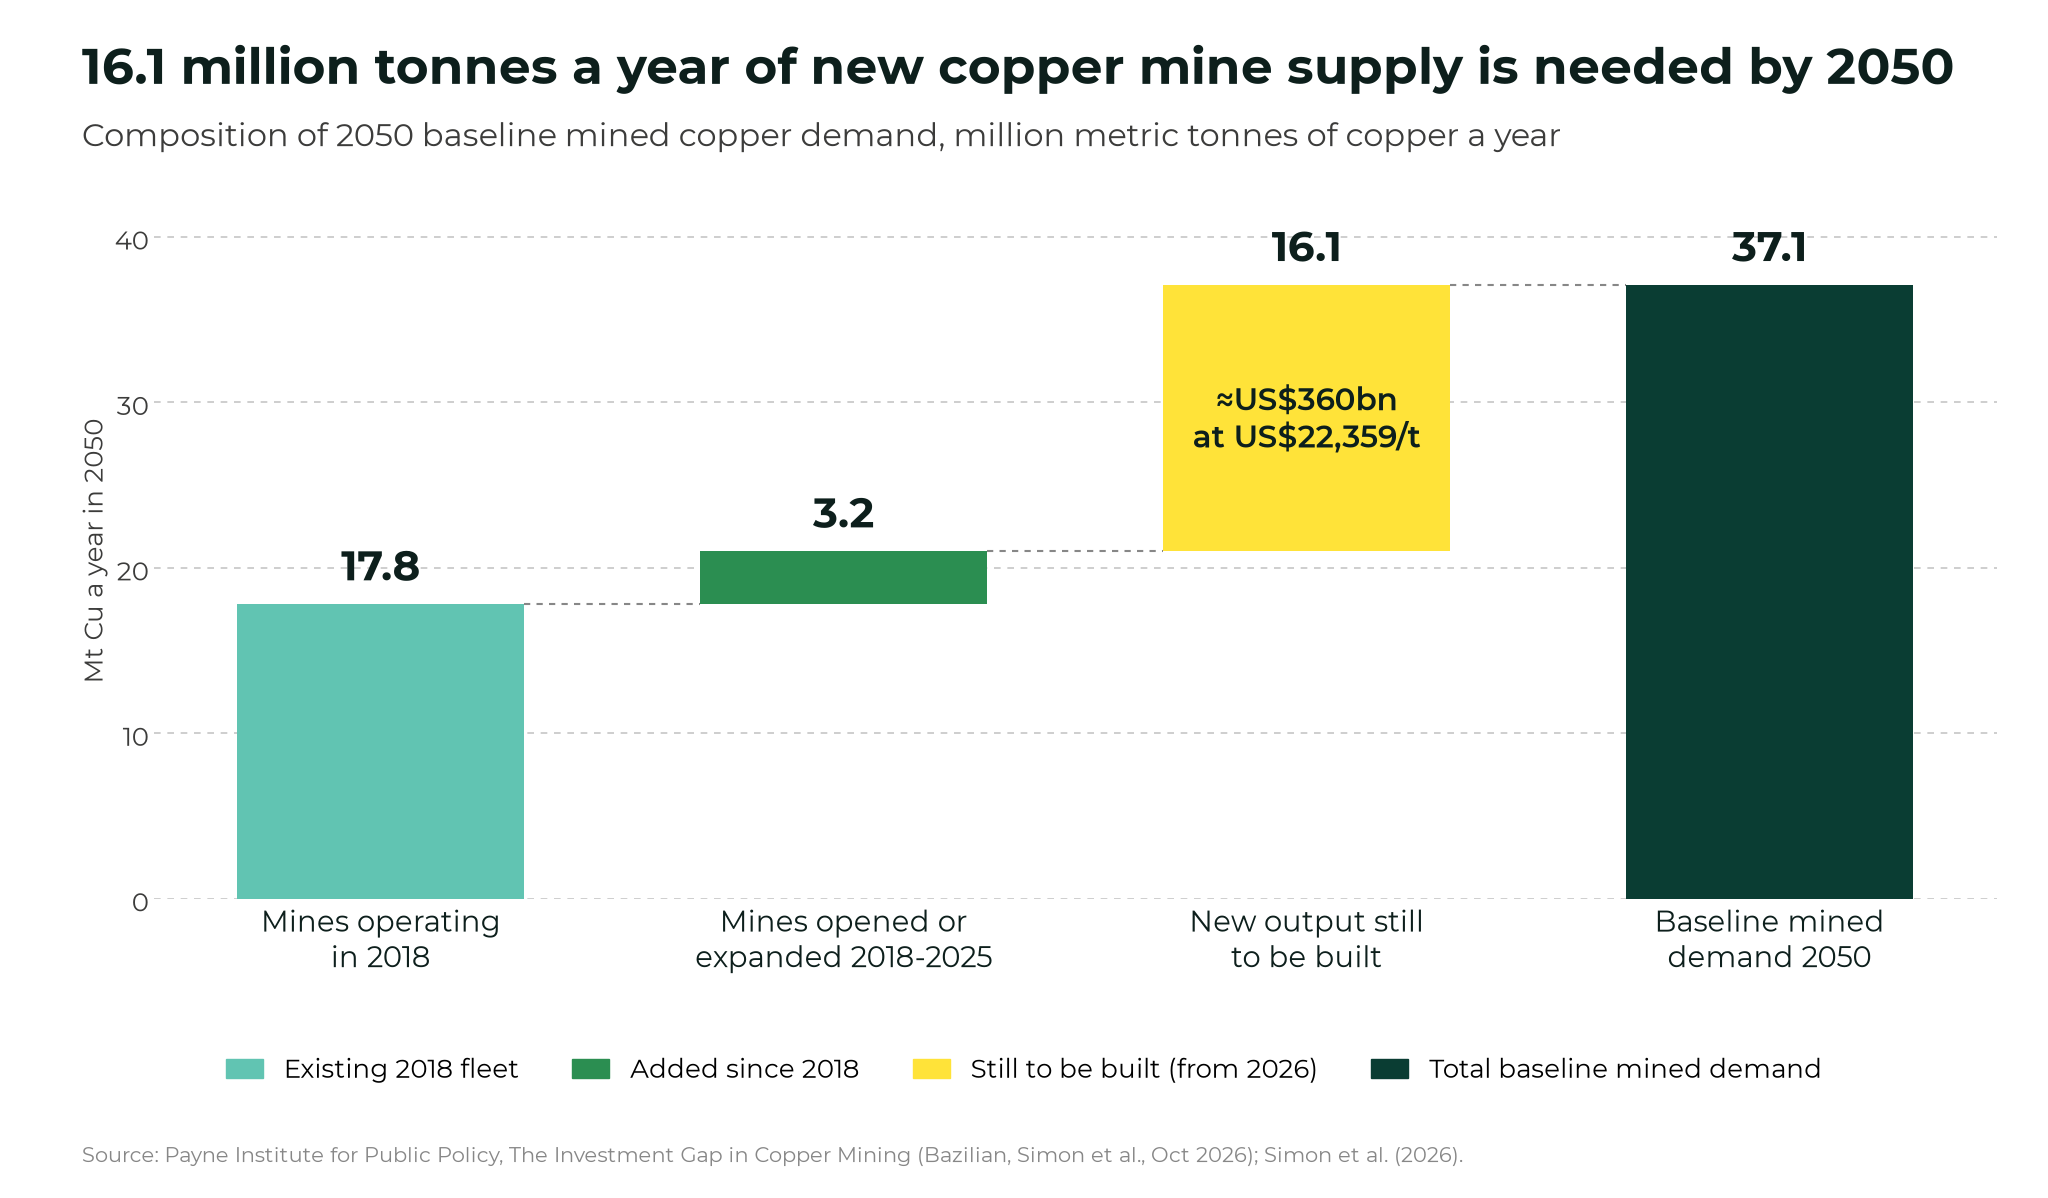
Waterfall chart of 2050 baseline mined copper demand: mines operating in 2018 supply 17.8 million tonnes, mines opened or expanded 2018-2025 add 3.2 million tonnes, leaving 16.1 million tonnes a year of new output still to be built, costing about US$360 billion at US$22,359 per tonne, against baseline mined demand of 37.1 million tonnes.
Composition of 2050 baseline mined copper demand, million tonnes a year. Source: Payne Institute (2026); Simon et al. (2026).

How big is the gap?

Demand for mined copper is projected to reach 37.1 million tonnes a year by 2050, but mines that were operating in 2018 will produce only 17.8 million tonnes of that by 2050 as they deplete and close. Mines opened or expanded since 2018 have added about 3.2 million tonnes a year, which leaves 16.1 million tonnes a year still to be built from 2026 onwards. That is more than two-thirds of the 23.5 million tonnes the world mined in 2025, based on WBMS data cited in the paper.

How much will it cost?

Priced at the US$22,359-a-tonne average of the 26 projects due to start by 2030, the 16.1 million tonnes costs about US$360 billion in 2024 dollars.

The bill also depends on how fast demand grows. Across the paper’s demand scenarios, it runs from US$280 billion, if leaching tailings and stockpiles supplies 4 million tonnes a year at US$2,500 a tonne, to US$552 billion under full vehicle electrification with grid expansion.
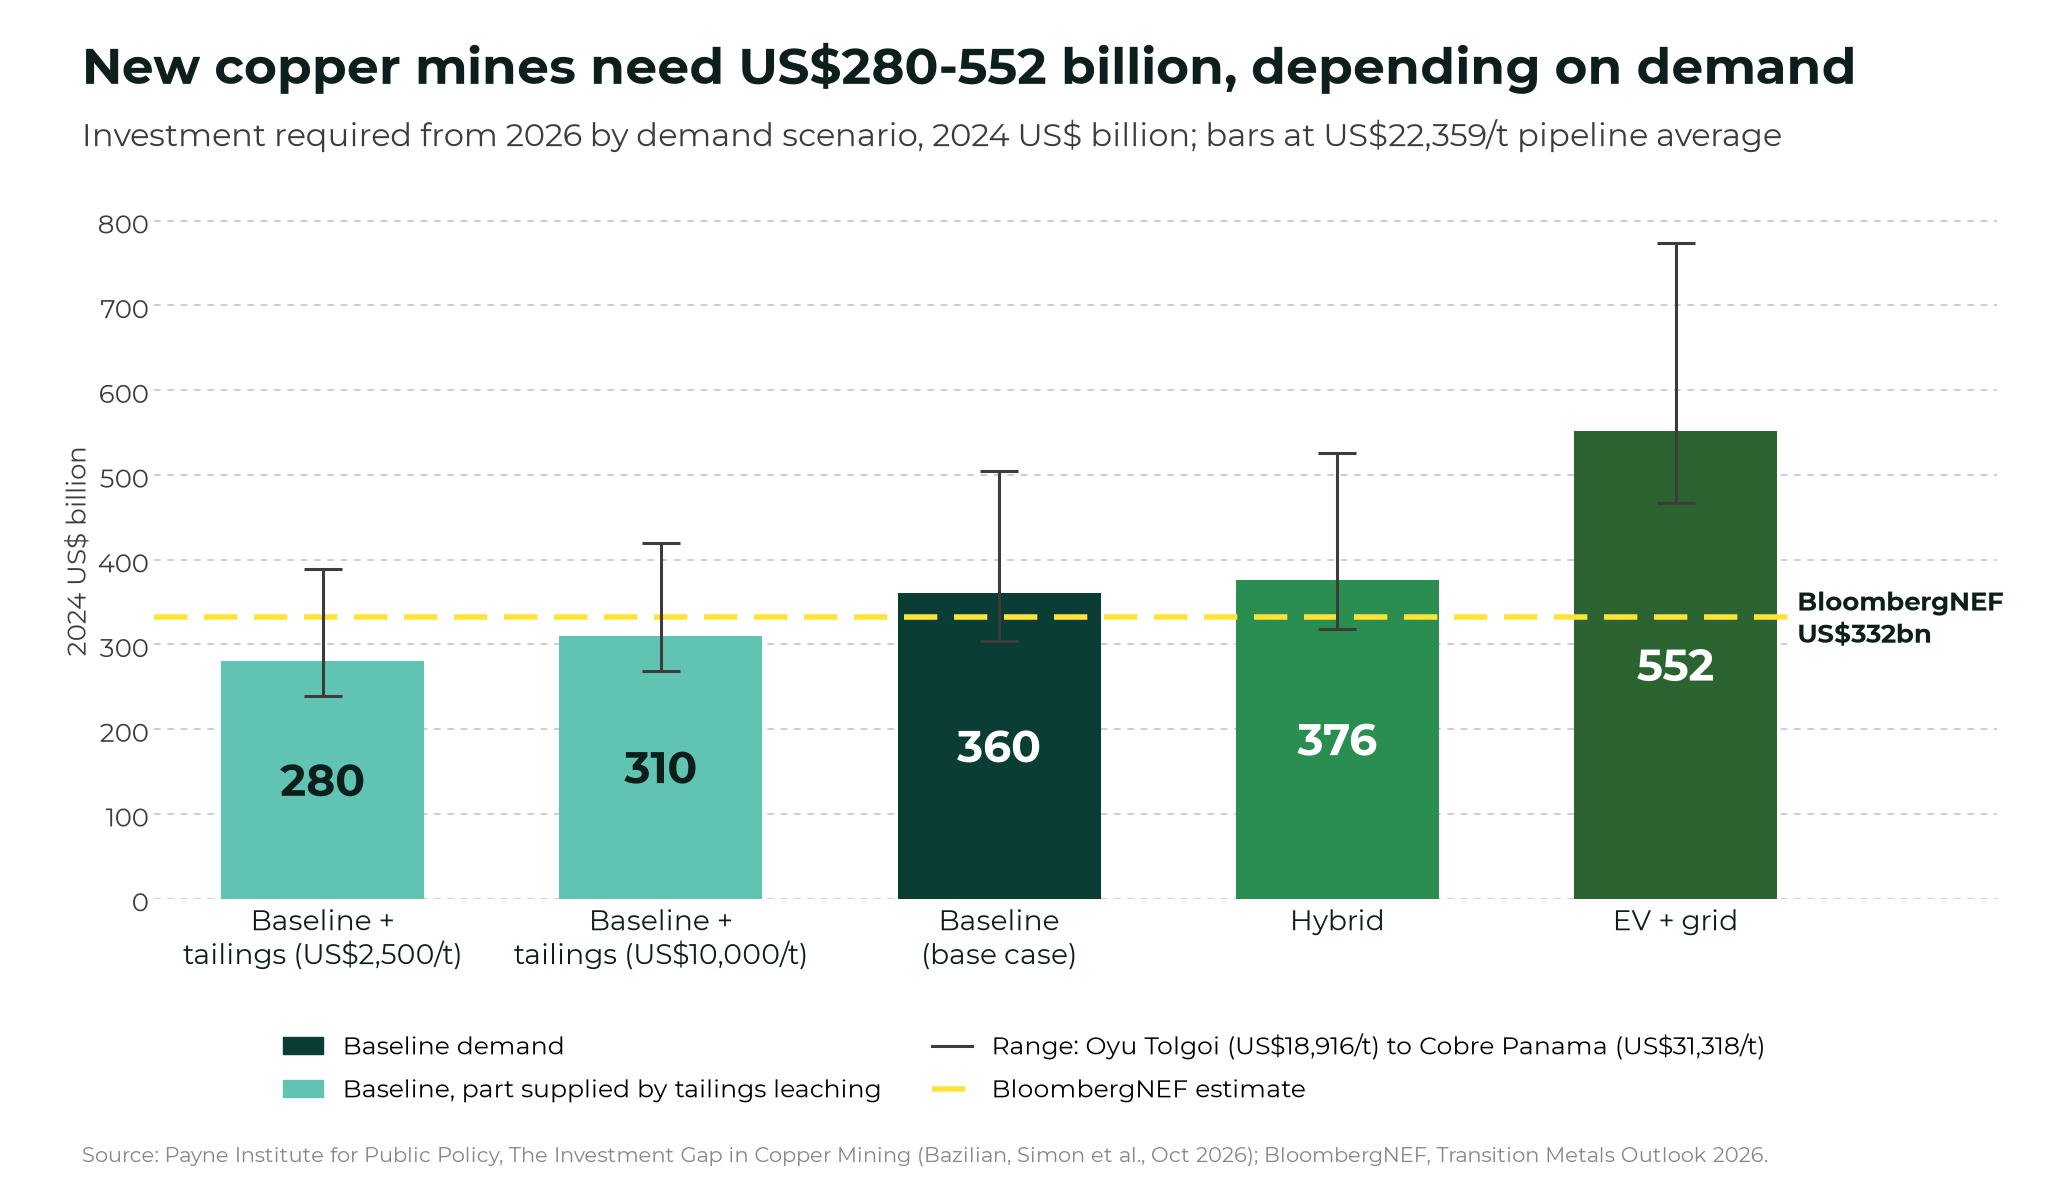
Bar chart of investment required from 2026 by demand scenario in 2024 US$ billion: baseline with tailings at US$2,500 a tonne 280, baseline with tailings at US$10,000 a tonne 310, baseline 360, hybrid 376, and EV plus grid 552, with range bars from Oyu Tolgoi to Cobre Panama capital costs and a dashed line at BloombergNEF's US$332 billion.
Investment required from 2026 by demand scenario, 2024 US$ billion. Range bars span Oyu Tolgoi (US$18,916/t) to Cobre Panama (US$31,318/t). Source: Payne Institute (2026); BloombergNEF.

What BloombergNEF found

BloombergNEF’s Transition Metals Outlook 2026, published October 20, found that nine of the 10 materials it studies are on track to have sufficient supply capacity through 2050.

That is an improvement on last year’s outlook, when three materials were projected to face deficits.

Copper is the exception.

BNEF forecasts a copper supply deficit beginning in 2028 and widening to 20 million metric tonnes by 2050, equal to 44% of projected demand. Copper demand is expected to rise 61% between 2026 and 2050, to almost 46 million tonnes, with copper use in electrified transport alone up 244% to 11.4 million tonnes.

Closing that deficit could require US$332 billion of new mines — but even then, new mines take an average of 17 years to come into operation, so the shortfall could persist for decades.
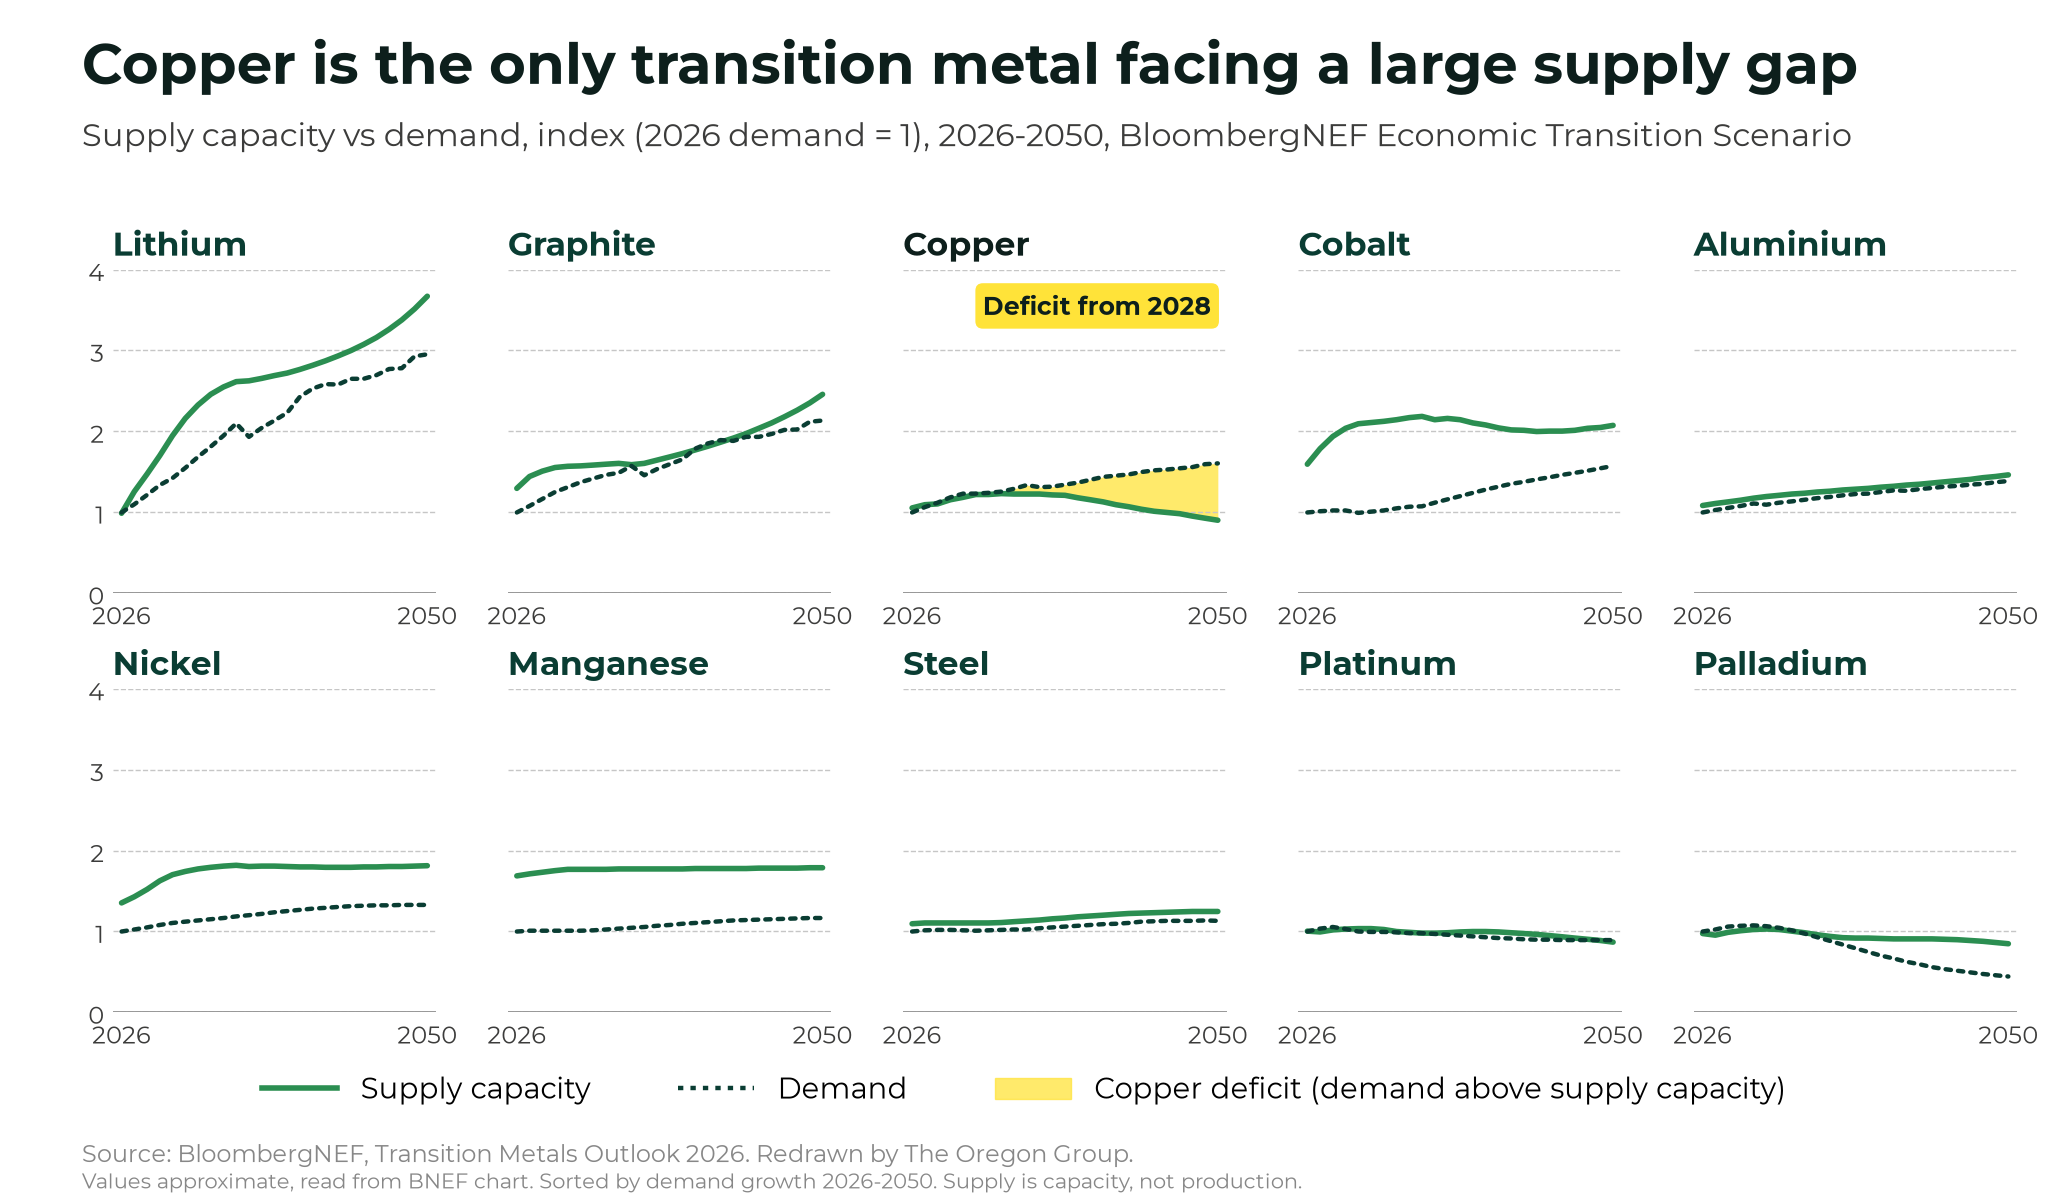
Ten small line charts redrawn from BloombergNEF's Transition Metals Outlook 2026 comparing supply capacity with demand from 2026 to 2050, indexed to 2026 demand. Supply capacity stays above demand for lithium, graphite, cobalt, aluminium, nickel, manganese and steel, while copper demand rises above falling supply capacity from 2028. Values approximate.
Supply capacity vs demand, index (2026 demand = 1), 2026-2050, BNEF Economic Transition Scenario. Source: BloombergNEF, Transition Metals Outlook 2026. Redrawn by The Oregon Group.

Martin Tengler, head of metals and mining at BloombergNEF, said:

“The challenge now is less about whether the world can produce enough metals overall, and more about whether the right materials will be available when and where they are needed.”

Martin Tengler, head of metals and mining, BloombergNEF

The Payne authors say BNEF’s physical gap is close to theirs, but the difference is cost with BNEF’s totals imply about US$16,600 per tonne of capacity, 26% below the pipeline average and below Oyu Tolgoi, the cheapest benchmark project in the paper.

Why mines are getting more expensive

The cost comes from capital intensity, meaning how much it costs to build one tonne of annual production.

The 26 copper projects due to start by 2030 average US$22,359 per tonne of annual output, in 2024 dollars, with the global average in 2000 was US$4,000 to US$5,000.

Falling grades mean miners have to dig and process far more rock for every tonne of copper.
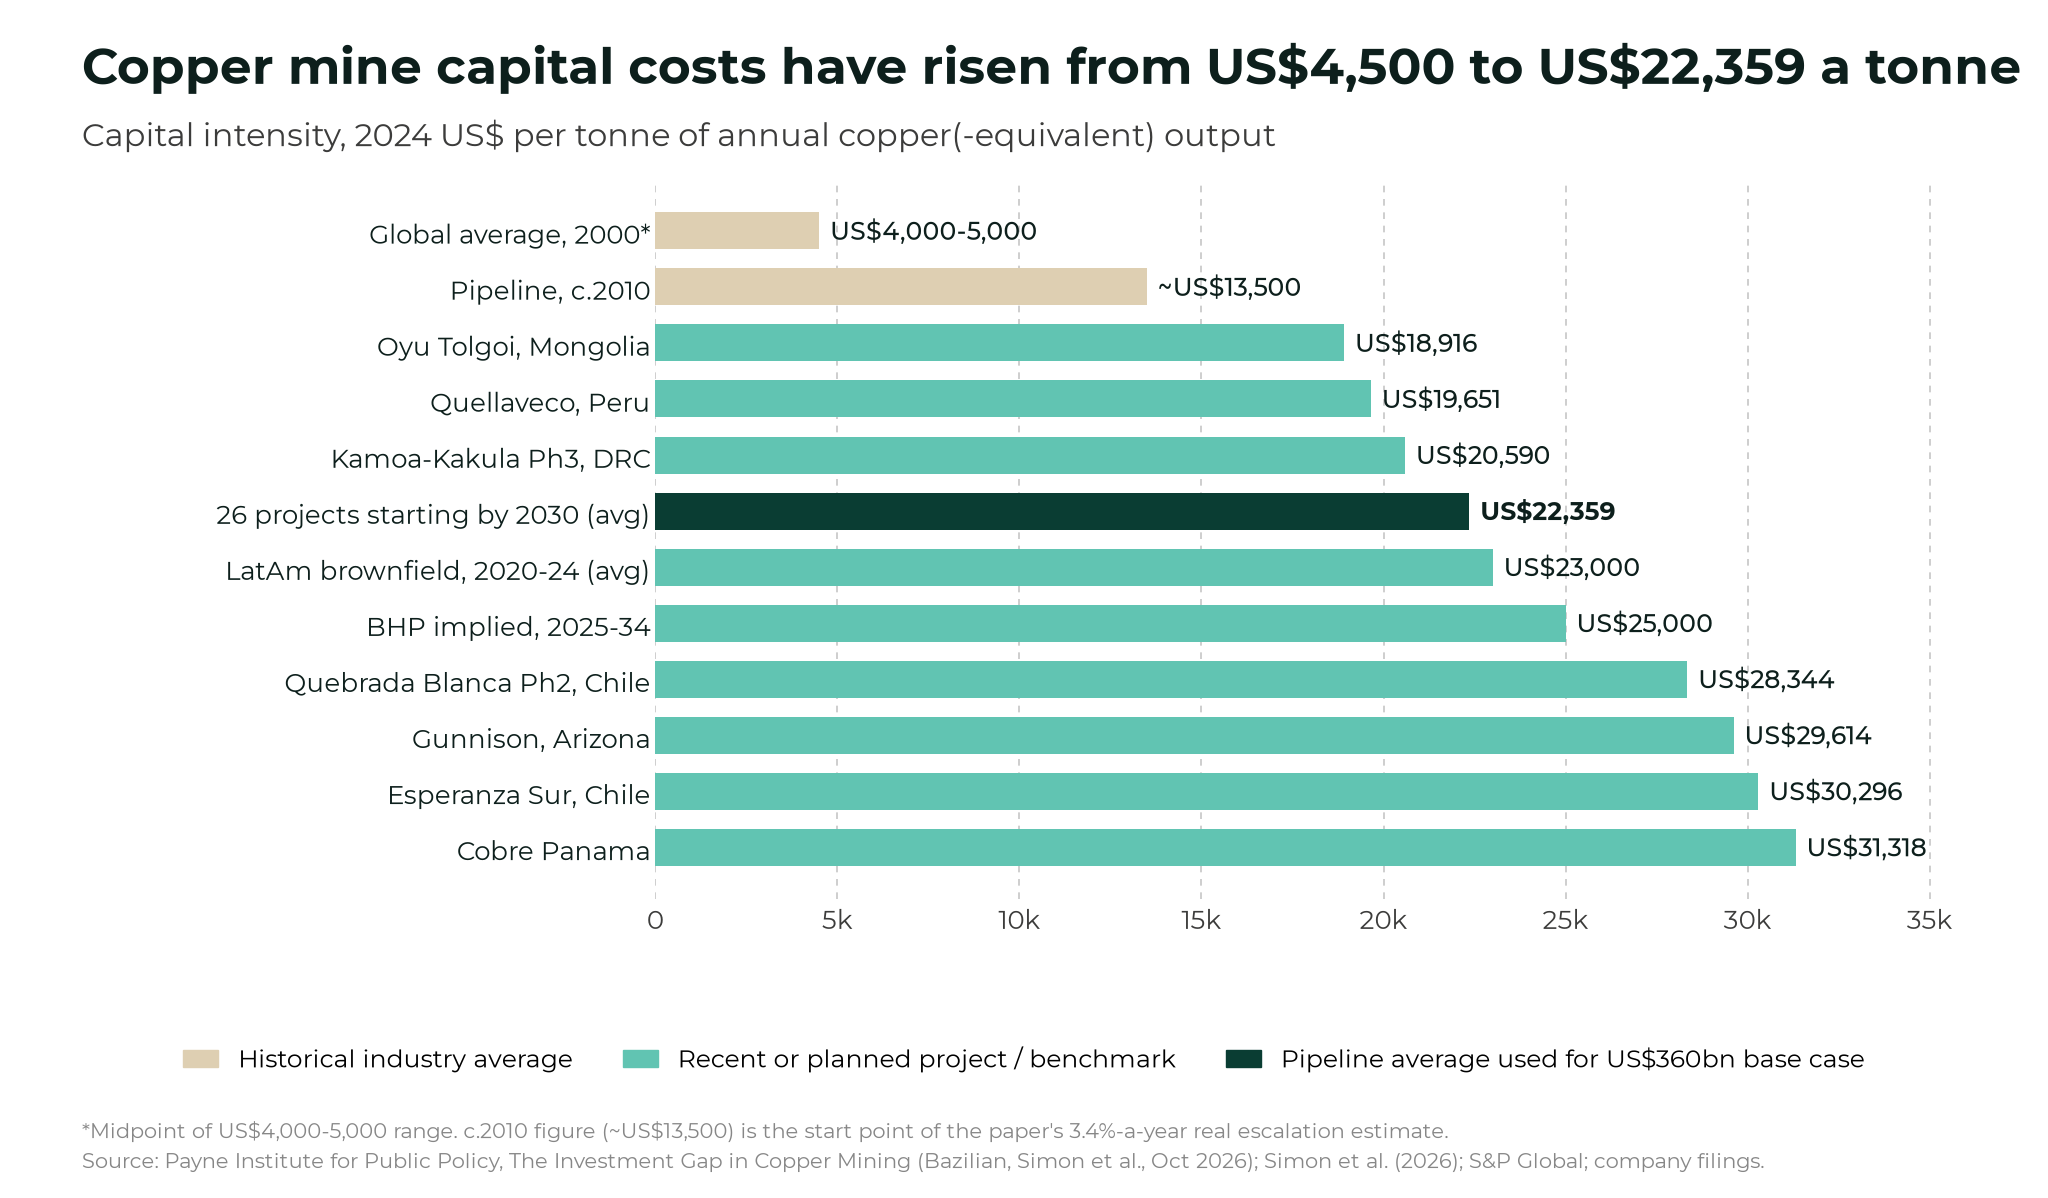
Horizontal bar chart of copper mine capital intensity in 2024 US dollars per tonne of annual output: global average US$4,000-5,000 in 2000, about US$13,500 around 2010, US$22,359 average for 26 projects starting by 2030, and named projects from Oyu Tolgoi at US$18,916 to Cobre Panama at US$31,318.
Capital intensity, 2024 US$ per tonne of annual copper(-equivalent) output. Source: Payne Institute (2026); Simon et al. (2026); S&P Global; company filings.

For example, in Chile, the world’s largest copper producer, the average grade of ore processed fell from 1.10% in 2002 to 0.58% in 2025. New supply is increasingly coming from deep underground block caves and high-altitude projects that need desalinated water pumped inland.

Cost overruns add to the bill, for example, Teck’s Quebrada Blanca Phase 2 in Chile was sanctioned at US$4.74 billion in 2018 and finished at US$8.6 billion to US$8.8 billion.

If real capital costs keep rising at 3.4% to 3.6% a year, as they have since 2010, the total cost could climb to US$545 billion.

Where the money would go

Chile has the largest single-country requirement, at US$90 billion to US$112 billion, because it combines the biggest production base with some of the highest building costs.
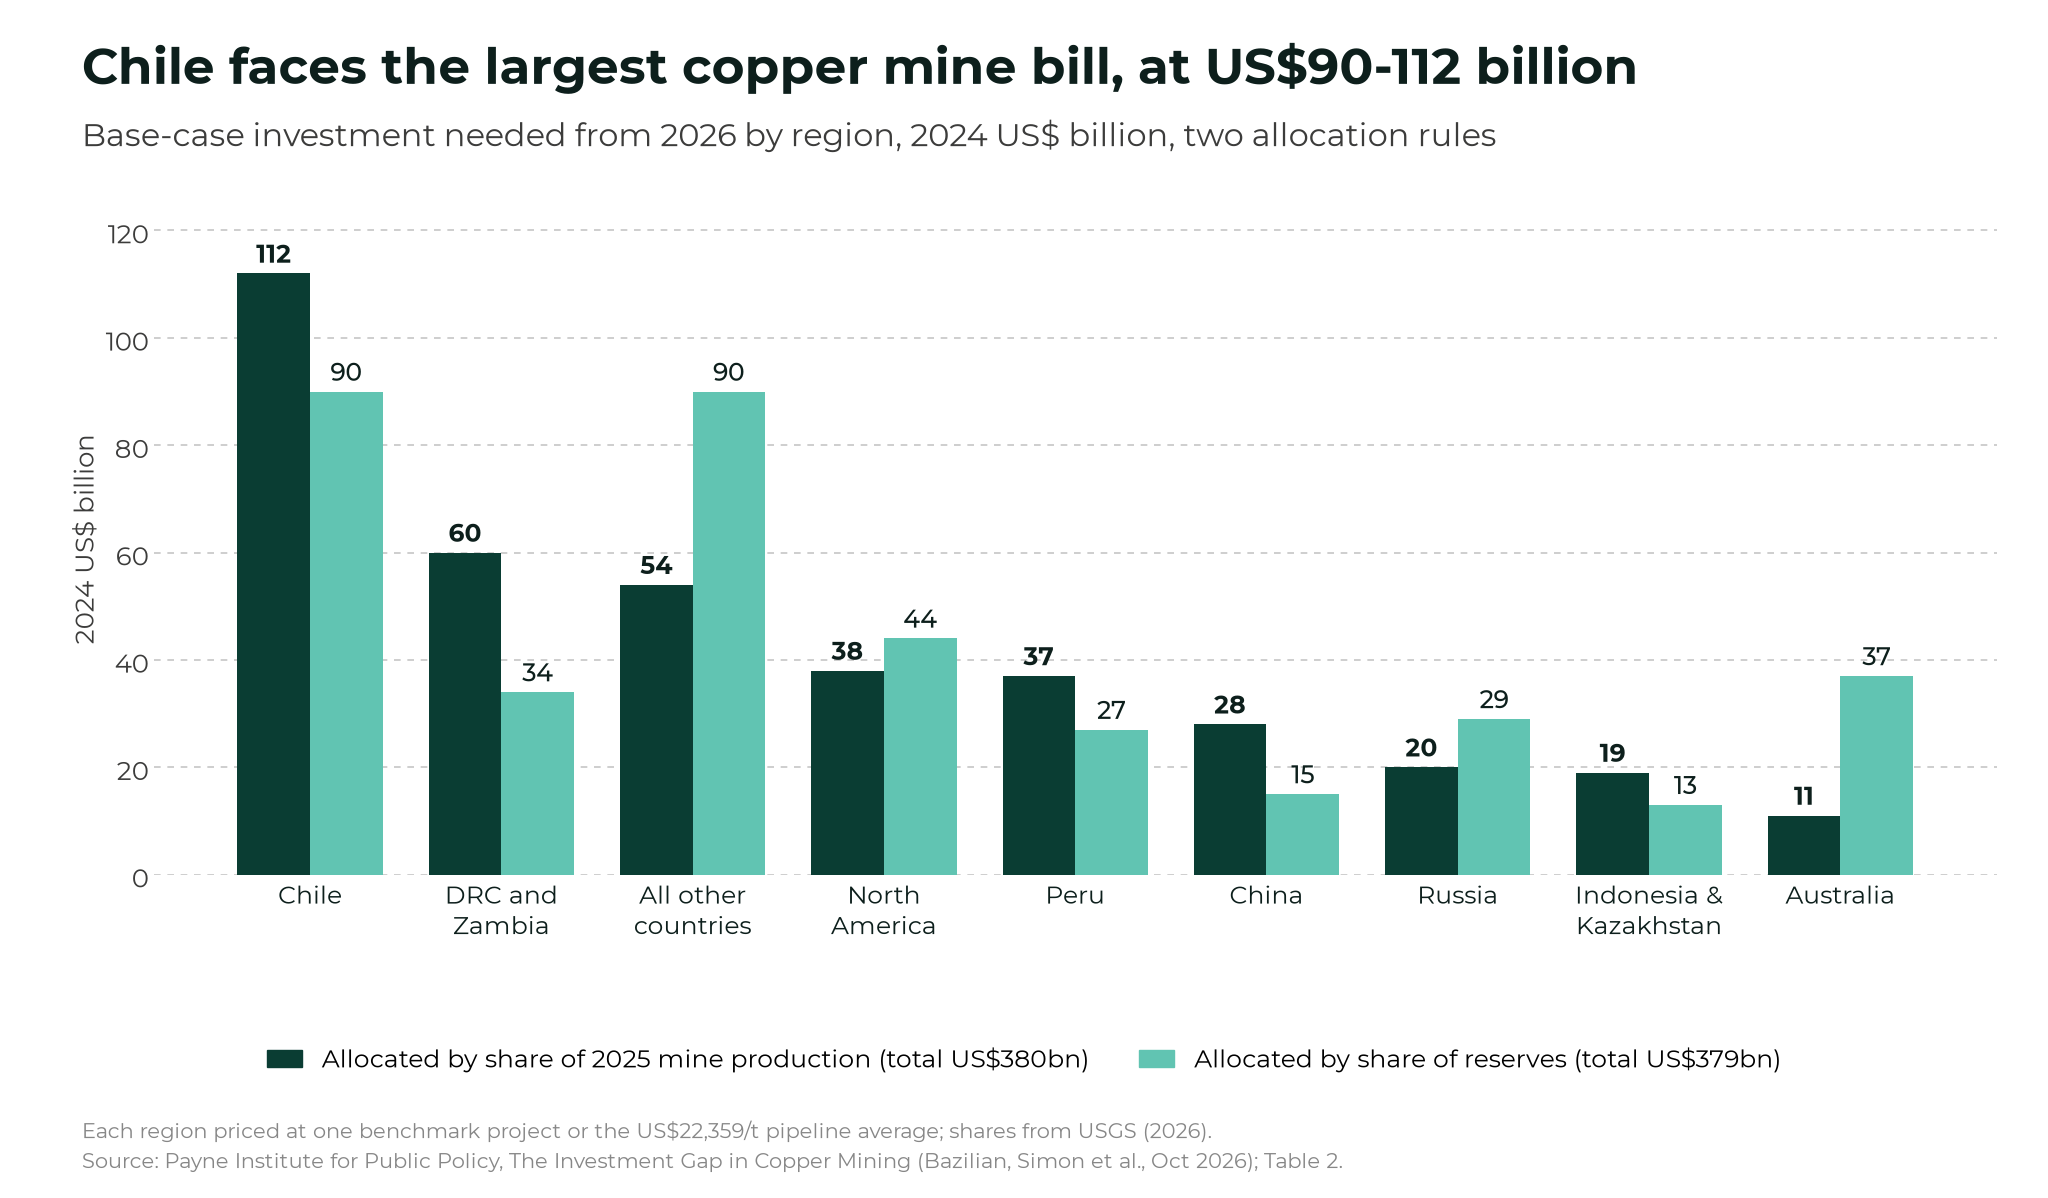
Grouped bar chart of base-case copper mine investment needed from 2026 by region, in 2024 US$ billion, allocated by share of 2025 mine production and by share of reserves: Chile 112 and 90, DRC and Zambia 60 and 34, all other countries 54 and 90, North America 38 and 44, Peru 37 and 27, China 28 and 15, Russia 20 and 29, Indonesia and Kazakhstan 19 and 13, Australia 11 and 37.
Base-case investment by region, 2024 US$ billion, allocated by 2025 production share and by reserve share. Source: Payne Institute (2026), Table 2.

A large share of the remaining capital would fall in jurisdictions such as Argentina, Mongolia and Panama, where permitting and political risk are high.

Deposits alone are unlikely to fill the gap, with the 149 undeveloped deposits in their database average just 0.37% copper, against 0.50% for mines operating in 2018 — most of them have been known for decades without being built.

The case that the gap is manageable

Despite the significant headline cost figure, if spread over 2026 to 2050, the financial requirement works out at US$14 billion to US$18 billion a year, which is within what the industry has spent on copper projects in recent years.

Leaching copper from existing stockpiles could also cut the bill; for example, Freeport-McMoRan aims to add about 360,000 tonnes a year this way for roughly US$1 billion, against about US$10 billion for a new mine of similar size.

The near-term market also looks well supplied with the International Copper Study Group expecting a refined copper surplus of 104,000 tonnes this year, widening to 368,000 tonnes in 2027.

But that surplus sits on top of fragile mine supply: in the September quarter, BHP’s copper output fell 19% led by a 23% drop at Escondida, where BHP had planned for lower grades.

And because even a permitted project needs several years to reach first output, there is a risk that capital committed now could close little of the 2030 shortfall.

The constraint on copper is not necessarily financial, but the permits, community consent and prices needed to commit it in time.

Subscribe for Investment Insights. Stay Ahead.

Investment market and industry insights delivered to you in real-time.

Disclaimer

The Oregon Group maintains full editorial control over all content published on this website. While sponsored and advertised placements may be featured, the content remains the sole opinion of The Oregon Group. The author may receive compensation or remuneration for providing content, but all statements and expressions are made independently and are not influenced by sponsors or advertisers. From time to time, The Oregon Group and its directors, officers, partners, employees, authors, or members of their families, as well as persons who are interviewed for articles on this website, may have a long or short position in securities or commodities mentioned and may make purchases and/or sales of those securities or commodities in the open market or otherwise. By accessing and using this website, readers are cautioned to assume that each of the foregoing persons may have a financial interest in all companies and sectors mentioned on this website. Any projections, market outlooks or estimates herein are forward looking statements and are inherently unreliable., and any such statements are based upon certain assumptions and should not be construed to be indicative of the actual events that will occur.  Other events that were not taken into account may occur and may significantly affect the returns or performance of the securities or commodities discussed herein. The information provided herein is based on matters as they exist as of the date of preparation and not as of any future date, and The Oregon Group undertakes no obligation to correct, update or revise the information in this document or to otherwise provide any additional material. The information provided on this website is for informational purposes only and is not, directly or indirectly, an offer, solicitation of an offer and/or a recommendation to buy or sell any security or commodity, and the information provided on this website should not be construed as any advice or an opinion as to the price at which the securities of any company or commodity may trade at any time. The Oregon Group is a publisher of financial information, not an investment advisor.  We do not provide personalized or individualized investment advice or information that is tailored to the needs of any particular recipient, and the information provided on this website is not and should not be construed as personal, financial, investment or professional advice. Readers are cautioned to always do their own research and review of publicly available information and to consult their professional and registered advisors before purchasing or selling any securities or commodities and should not rely on the information contained herein. Neither The Oregon Group nor any of its affiliates accepts any liability whatsoever for any direct or consequential loss howsoever arising, directly or indirectly, from any use of the information contained herein. By using the Site or any affiliated social media account, you are indicating your consent and agreement to this disclaimer and our terms of use. Unauthorized reproduction of this newsletter or its contents by photocopy, facsimile or any other means is illegal and punishable by law.

Share this article

about the author

Picture of The Oregon Group

The Oregon Group

The Oregon Group is an investment research team focused on critical minerals, mining, energy and geopolitics.

Tags

Subscribe Now

Subscribe for in-depth market and industry intelligence you won’t find in the headlines.

Recommended to Read NEXT

GET FREE INVESTMENT INSIGHTS

Investment intelligence and in-depth reports on critical minerals, mining, energy and geopolitics — from capital-markets professionals with boardroom and institutional experience.