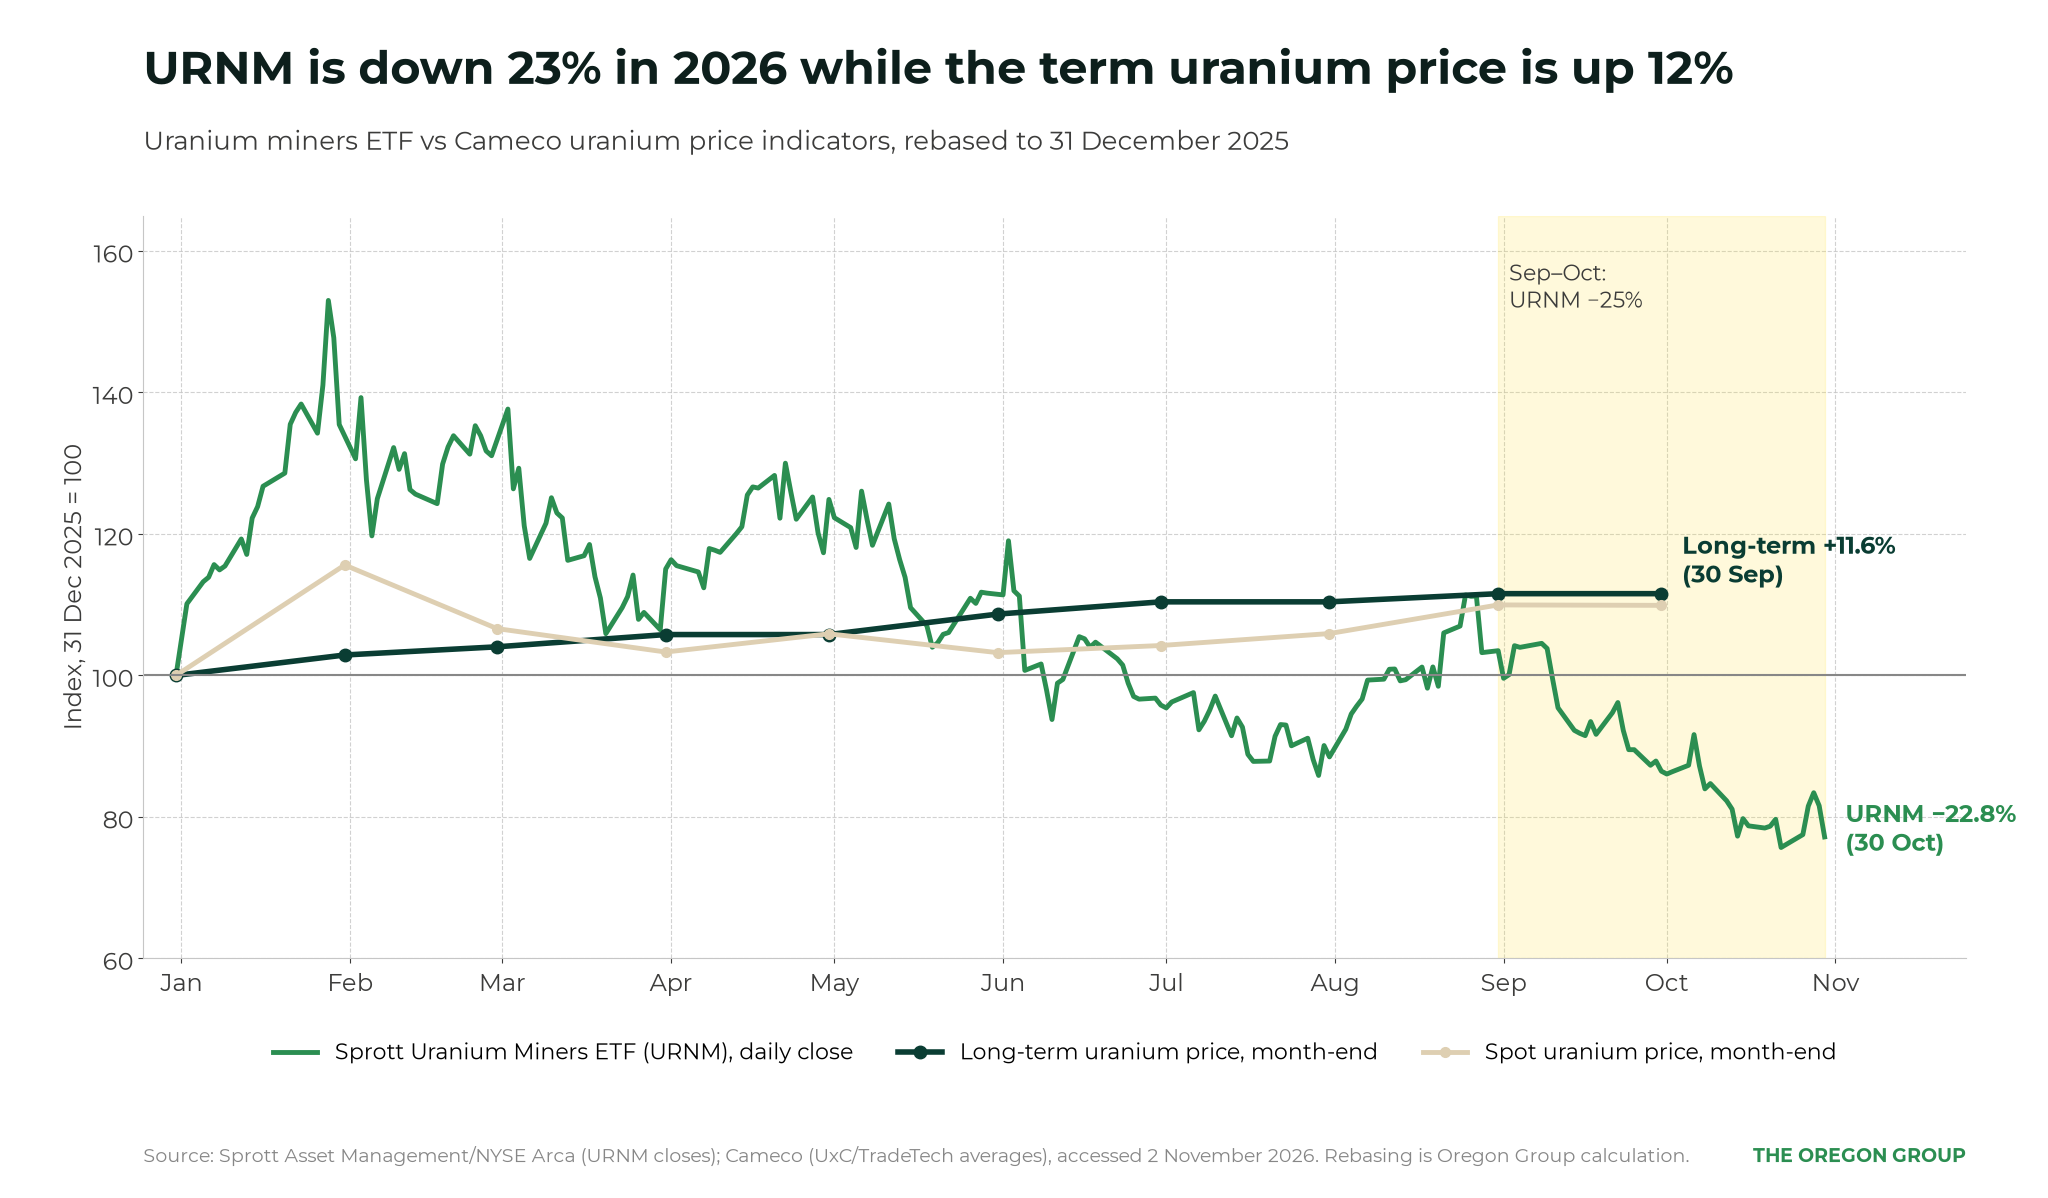
- the Sprott Uranium Miners ETF (URNM) lost 16.46% in September and a further 10.69% in October, about 25% over the two months by our calculation
- over the same period, spot uranium edged up from US$89.68/lb at the end of August to about US$92.74/lb on October 30, while Cameco’s long-term indicator held at US$96.50/lb
Uranium stocks sold off in September, but without a matching collapse in the fuel price.
So, what’s going on?
Either the spot price is too high or mining equities are too low. And, as any reader of The Oregon Group, could guess, we suggest the latest sell-off in uranium mining equities reflects weaker sentiment rather than a deterioration in the sector’s underlying economics: uranium shares have become cheaper, while long-term uranium prices have held firm.
“Uranium miners are pricing in a broad-market correction, not a deterioration in uranium fundamentals”
— Paul Wong, Uranium Miners: A Liquidity Shock, Not a Broken Thesis, Sprott Uranium Report
But, the divergence also exposes another tension (and opportunity for investors!) with consequences beyond the stock market:
- utilities need dependable future supply
- mining companies need capital today to deliver it
A weaker equity market can make new mines harder to fund, even as firm uranium prices signal the need for more supply.
The price utilities are willing to pay and the terms on which investors will fund new mines can move in opposite directions.
That is where September-October’s sell-off becomes more interesting.
The uranium price signal has moved into contracts
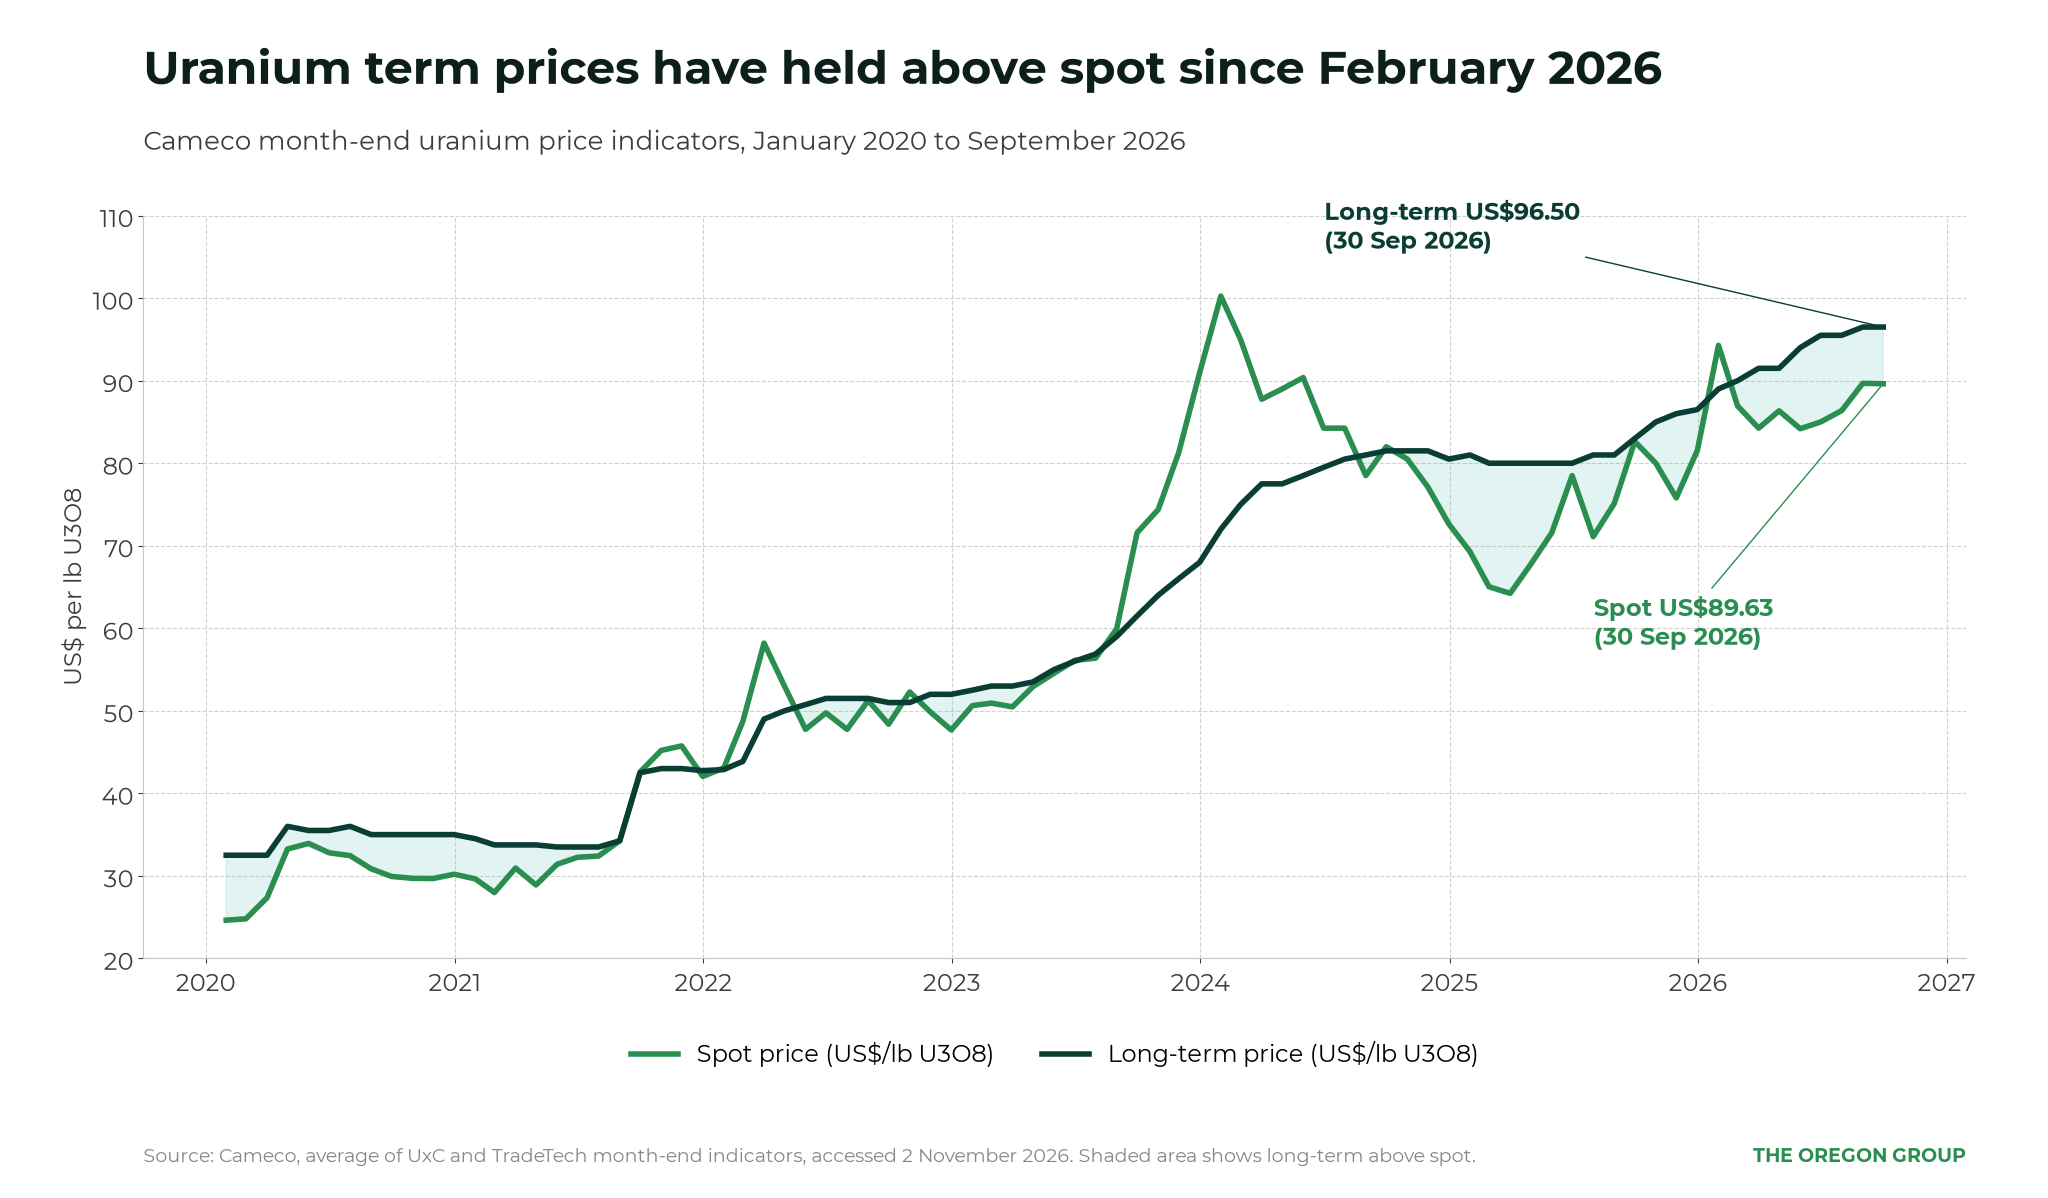
The strength in uranium pricing has survived the retreat from January’s spot peak, with Cameco’s month-end indicators, which average prices published by specialist firms UxC and TradeTech, show the difference:
| Uranium price indicator | December 2025 | January 2026 | September 2026 | Change since December |
|---|---|---|---|---|
| Spot | 81.55 | 94.28 | 89.63 | +9.9% |
| Long-term | 86.50 | 89.00 | 96.50 | +11.6% |
By September, Spot was about 4.9% below its January reading, but the long-term indicator kept rising. Cameco said in its third-quarter 2026 results on 30 October that the long-term price was “approaching its highest level since 2011 (in 2026 constant dollars)”. The firmness carried into October with TradeTech’s weekly spot indicator at US$89.75/lb and its long-term indicator US$97/lb in the week to October 23, with contract floors in the high US$70s and ceilings of US$140 to US$160, FNArena reported on 27 October. By 30 October, the price Sprott uses to value its trust, a composite of four price reporters, implied about US$92.74/lb (our calculation), even as uranium shares fell.
But, to take just the latest major example, supply from the West’s largest producer is not rising with the price:
Cameco’s McArthur River and Cigar Lake operations produced a combined 22.0 million lb (100% basis) in the first nine months of 2026, down from 24.6 million lb a year earlier, a fall of about 10% (our calculation from its third-quarter MD&A). Cameco narrowed its 2026 production guidance to 19.5 million to 20.5 million lb, from 19.5 million to 21.5 million lb, after an extended maintenance shutdown at the Key Lake mill, and warned there is a risk that output “may be impacted if there are restart challenges or delays in commissioning new equipment”. Chief executive Tim Gitzel was clear that higher prices alone will not change its plans. “We will not advance production, commit capital or pursue growth simply in response to headlines, short-term price movements or market enthusiasm surrounding any single theme,” he said in the company’s results release on 30 October.
For a mine developer, long-term prices support the commercial case for future production. But a price benchmark provides neither construction funding nor a guaranteed customer, which require negotiations over actual volumes, delivery dates and contract terms. A project can therefore look attractive at prevailing uranium prices while still facing difficult funding decisions, and the longer developers take to secure capital, the more that gap matters.
Liquidity dislocation in equities
Sprott argues that what we’re seeing in the uranium mining equities market is a liquidity trade:
“When volatility rises, leveraged investors reduce gross exposure, risk managers cut position limits, and systematic strategies sell assets with high realized volatility. The result is indiscriminate liquidation”
In other words, the market could turn with any stabilisation in liquidity.
Utilities’ purchasing gap lies ahead, but mining expenditure starts sooner
The timing of uncovered US uranium requirements helps explain the challenge.
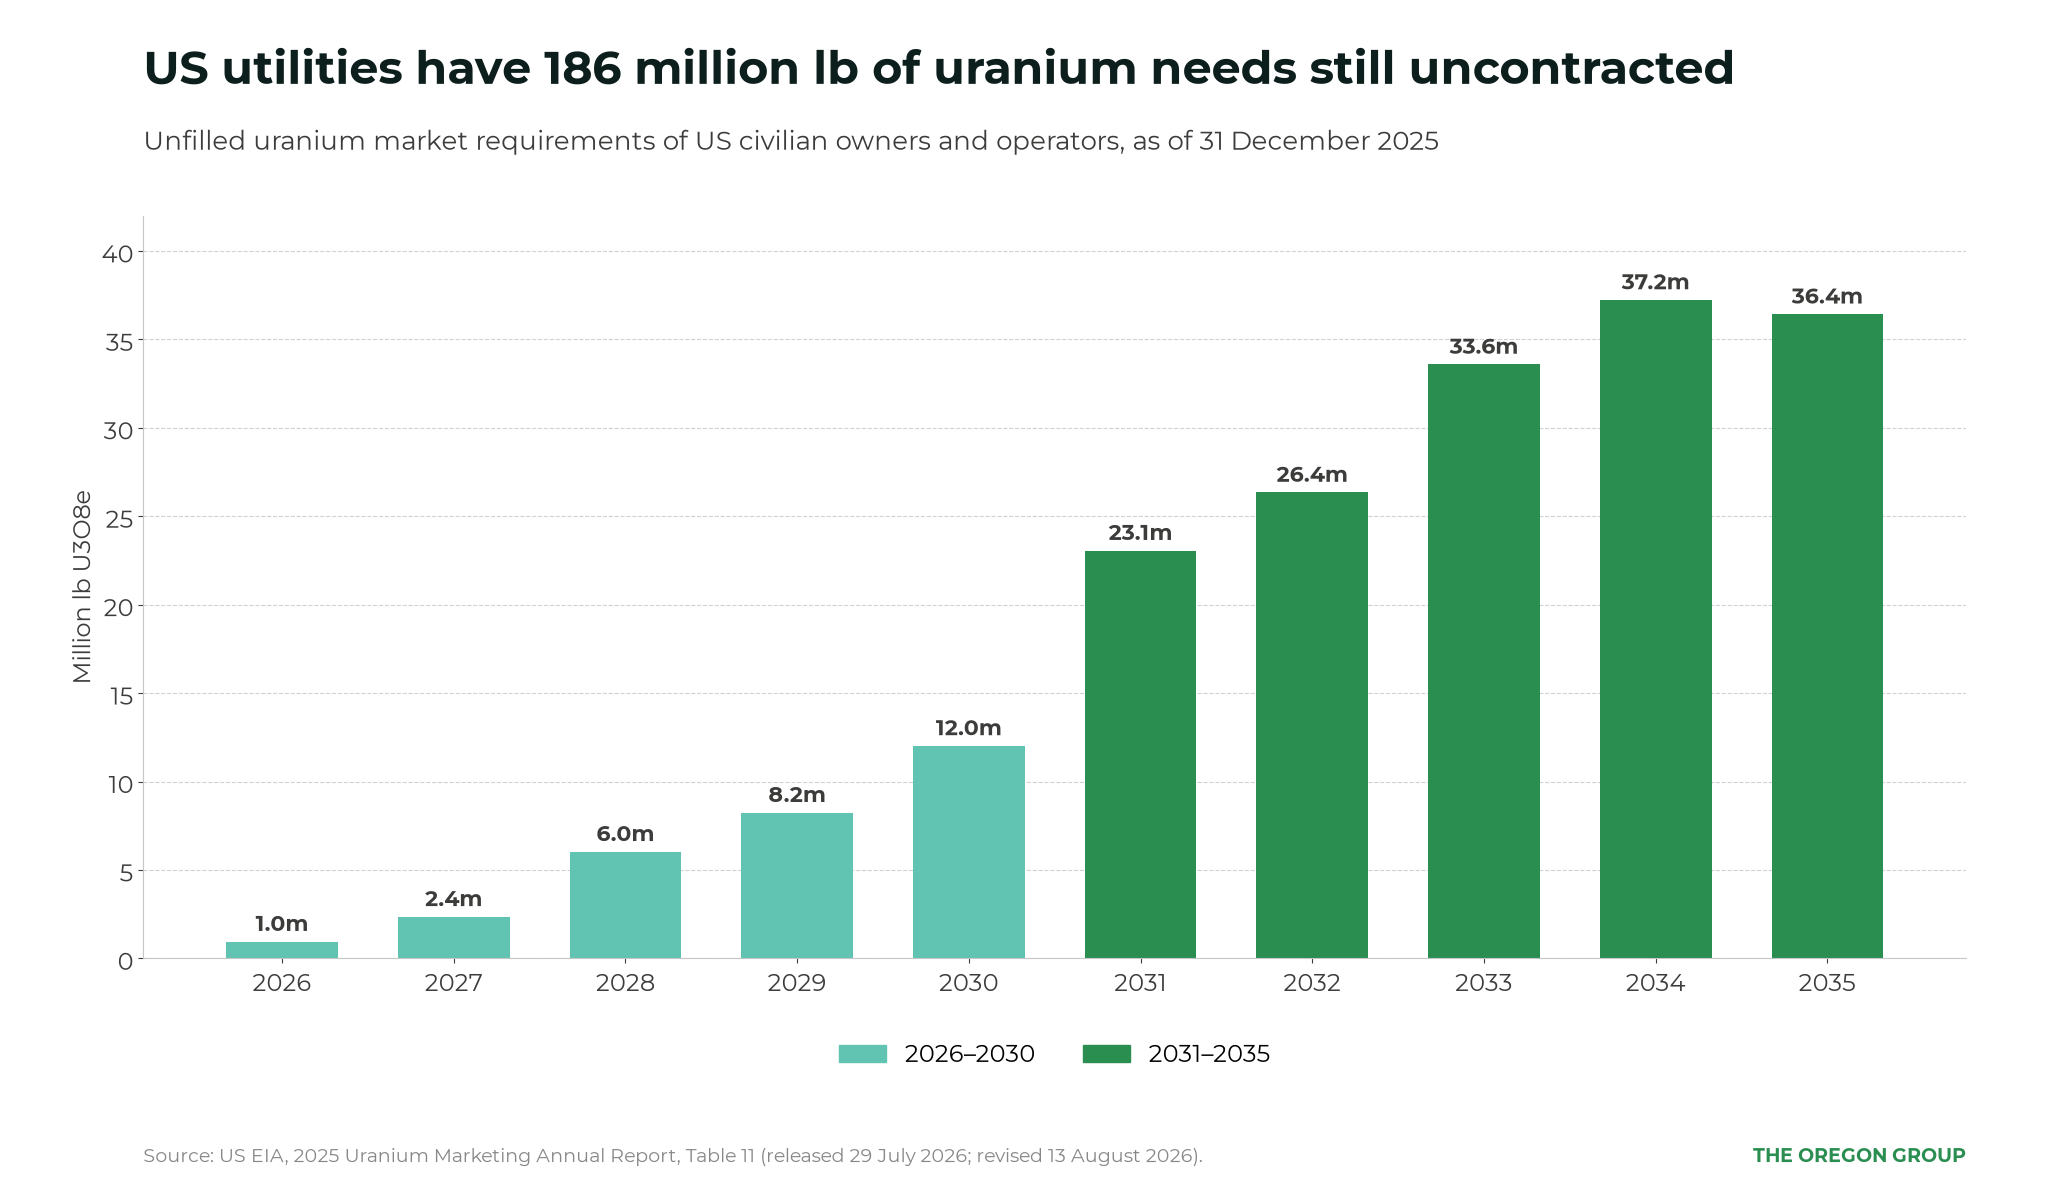
US utilities are largely covered through 2027, but a much larger procurement gap opens after that:
- at the end of 2025, utilities reported 186.3 million lbs U3O8e of uranium they expect to need through 2035 but have not yet contracted for; about 98% of that requirement is for 2028-2035
- the amount still needing to be secured rises from just 2.4 million lbs in 2027 to 23.1 million lbs in 2031
- and the annual figures become much larger further out with uncovered requirements reaching approx 12 million pounds in 2030 and 37.2 million pounds in 2034
In other words, US utilities are not facing an immediate shortage, but they will need to return to the market for increasingly large volumes later this decade, just as secondary supplies are shrinking.
Annual uranium mine supply could fall approx 46,000 tonnes below reactor requirements by 2040 under a high-demand scenario, equivalent to 41% of projected needs, The Oregon Group calculations from the new OECD-NEA and IAEA Red Book estimates show.
This means, for uranium mine developers, the clock has already started.
The reactor fleet that will need that fuel is already being built. There were 79 reactors under construction worldwide as of 16 October, with a combined capacity of about 86,560 MWe, according to the World Nuclear Association, led by China with 38. That is the highest number since 1986, Nikkei Asia reported on 2 November, as high fossil-fuel prices and power demand from AI data centres push governments and utilities back towards nuclear. Each of those units will need an initial fuel load and decades of reloads, much of it from mines that have not yet been financed.
New uranium mines can take 10 to 20 years to move from discovery to production, with some projects taking more than 20 years once exploration, permitting, financing and development are included, and the World Nuclear Association told the IAEA General Conference in September that some could take 20 years or more.
So, bringing on new supply cannot wait until a utility actually needs uranium.
The commercial opportunity sits years ahead of the expenditure needed to capture it.
Our earlier analysis, The Great Refill: utilities are back in the uranium market, examined the return to long-term purchasing. The next stage is the financial commitment needed to turn those purchases into additional mine supply.
F3 Uranium shows where the next supply cycle has to start
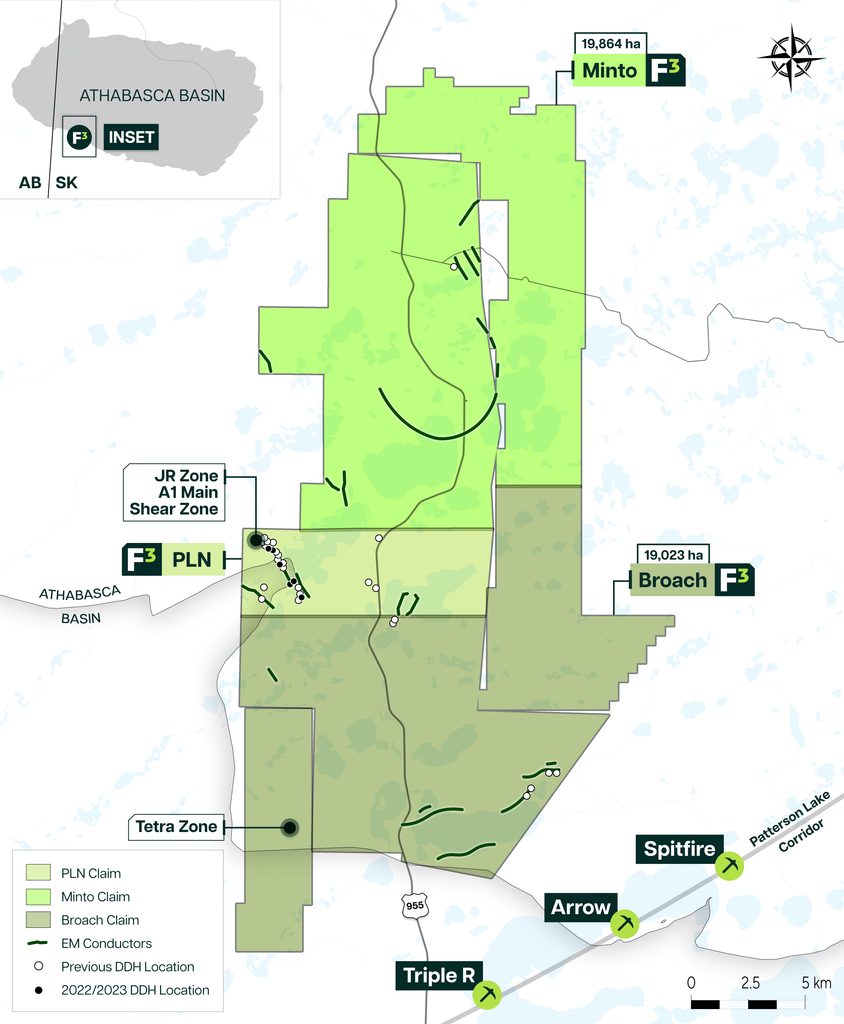
F3 Uranium (TSXV: FUU, OTCQB: FUUFF) is at the exploration and resource-development stage on its 100%-owned Patterson Lake North (PLN) project in Saskatchewan. Its JR Zone hosts an initial Indicated Mineral Resource of 11.8 million lb U3O8 at an average grade of 4.41%, including a high-grade domain of 10.8 million lb at 12.23%, announced in December 2025. We looked at how that grade compares across the district and clearly F3 Uranium’s high-grade resource stands out in the Athabasca Basin.
The 42,961-hectare project sits in the western Athabasca Basin, about 23km northwest of Paladin Energy’s Triple R deposit and near NexGen’s Arrow, two of Canada’s most significant undeveloped uranium deposits. F3 describes PLN as one of the largest contiguous land packages held by a single explorer along the southwest margin of the basin.
F3’s technical team also has direct experience in the district, with members of the team responsible for discovering Triple R in 2012 before advancing it through subsequent stages of development.
That matters because future uranium supply does not begin when utilities sign contracts. It begins years earlier with drilling, resource definition, engineering and permitting, all of which require capital before a mine produces a pound.
F3 has already demonstrated access to that capital. Denison Mines made a CAD$15 million strategic investment in the company through convertible debentures in 2023, explicitly supporting further assessment of PLN. F3 subsequently raised a further CAD$5.55 million through a bought-deal private placement in April 2026 to continue advancing its exploration programme.
Exploration has also moved beyond JR. At the Tetra Zone, 13km to the south, hole PLN25-219A returned 13.0 metres at 0.28% U3O8, including 3.0 metres at 1.19%, and F3 said in April 2026 that age dating and structural work link Tetra to the same mineralising system as JR. On 21 October it reported five intervals of anomalous radioactivity in hole PLN26-232, about 1km east of Tetra, peaking at 4,400 counts per second, the highest handheld reading on PLN outside JR and Tetra, and added a second rig. Assays are pending, and handheld readings indicate radioactivity rather than grade.
F3 highlights the other side of the uranium contracting gap where high-grade projects in established jurisdictions with experienced teams and access to capital sit much earlier in the uranium supply chain.
The funding terms could shape the supply response
Building new uranium supply in secure Western jurisdictions can require hundreds of millions to several billion dollars before first production.
For example, Denison’s Phoenix project in Saskatchewan, which took a final investment decision in February 2026 and targets first production in mid-2028, carries a post-FID initial capital estimate of about US$430 million (C$600 million), on top of about C$100 million of pre-FID spending. NexGen’s much larger Rook I project carries an estimated US$1.6 billion (C$2.2 billion) of pre-production capital, and the company said in September it still needs about US$1.1 billion (C$1.5 billion) and aims to be fully financed within six months.
The costs obviously vary sharply by project, but the range itself illustrates the size of the financing hurdles facing the next generation of Western uranium projects.
On 16 October, Deep Yellow withdrew its target of a fourth-quarter investment decision on its Tumas project in Namibia. “Despite the compelling global uranium market fundamentals, challenging equity market conditions continue to constrain funding options for uranium developers,” chief executive Greg Field said. A week later, Bannerman Energy’s Etango joint venture, 45% owned by CNNC Overseas, approved its US$353 million mine without debt, funded from joint-venture cash and backed by an offtake framework. The difference was not the uranium price, which both faced, but access to a strategic partner’s balance sheet.
If developers cannot raise that money on acceptable terms, projects can be delayed even when uranium prices are high enough to make the underlying resource economically feasible.
The challenge is that utilities cannot simply wait until they need the uranium.
Contracted coverage by US utilities falls to around 60% of anticipated requirements in 2030 and about 9% by 2033, but utilities cannot wait until 2030 or 2033 for the mines to be built to secure those pounds: 2026 is on track to be the 14th consecutive year of below-replacement contracting, according to Sprott.
Uranium is typically secured through multi-year term contracts, with deliveries often beginning several years after signing. It must then move through conversion, enrichment and fuel fabrication before reaching a reactor.
“Utilities will recognize that their future requirements must be secured from a limited and increasingly committed supply base. With contracting still substantially below replacement needs and future uranium already priced at 18-year highs, that recognition could begin influencing the market long before the associated uranium is delivered”: Sprott, On the Cusp of a New Contracting Cycle
The funding terms could shape the supply response
The financial timetable in uranium supply works “backwards”.
A utility that needs uranium in 2032 may need to secure the contract several years earlier. A mine expected to fulfil that contract must be financed, permitted and built earlier still.
That means the financing decision comes first.
If developers cannot raise enough money (on acceptable terms), projects are delayed and, if enough projects are delayed, less new uranium reaches the market when utilities eventually need it, at which point, higher uranium prices cannot produce an immediate supply response.
This is why governments, utilities and strategic investors are increasingly looking for ways to secure future supply before the shortage appears, through mechanisms such as long-term contracts, price floors and downside protection, prepayment agreements, offtake-backed financing, direct strategic investment and equity partnerships, as well as government procurement programmes.
These structures can help a project get built, but they also determine who receives the economic benefit.
A utility that provides capital may secure future supply; a lender receives interest and repayment protection; a strategic investor may receive equity or rights to future production; and existing shareholders keep the value remaining after those commitments are made.
The result is that the uranium price alone may not determine how quickly new Western supply reaches the market. The cost and availability of capital, and the terms buyers are willing to offer to secure future pounds, are increasingly just as important.
The uranium market has a price for future supply. Bringing that supply into production still requires someone to pay the construction bill, but if nobody pays to build the next generation of mines now, utilities may end up paying more later for a smaller pool of available supply.