

- Russia supplied approx 26% of US enrichment purchases in 2025, despite the import ban and approaching end of temporary waivers
- a CNNC subsidiary has agreed to purchase 60% of Etango’s lifetime uranium production, linking Chinese investment directly to future supply
- Western enrichment expansion is advancing, but substantial additions arrive from 2028 and, for Urenco’s latest US project, from 2032
Russia supplied 26% of the enrichment services purchased by US nuclear operators in 2025, up from approx 20% a year earlier — but under existing US law, waivers permitting imports of Russian enriched uranium must end by 1 January 2028.
The contradiction sits at the centre of one of the most significant shifts in the global uranium market: it is increasingly divided into separate East–West supply networks.
But it’s not just Russia vs the West.
Both China and the West (from the US, Europe to Japan already with their much larger existing nuclear fleets) are racing to expand their nuclear reactor fleets — and secure access to the uranium supply to fuel them.
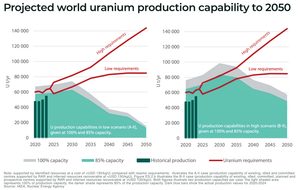
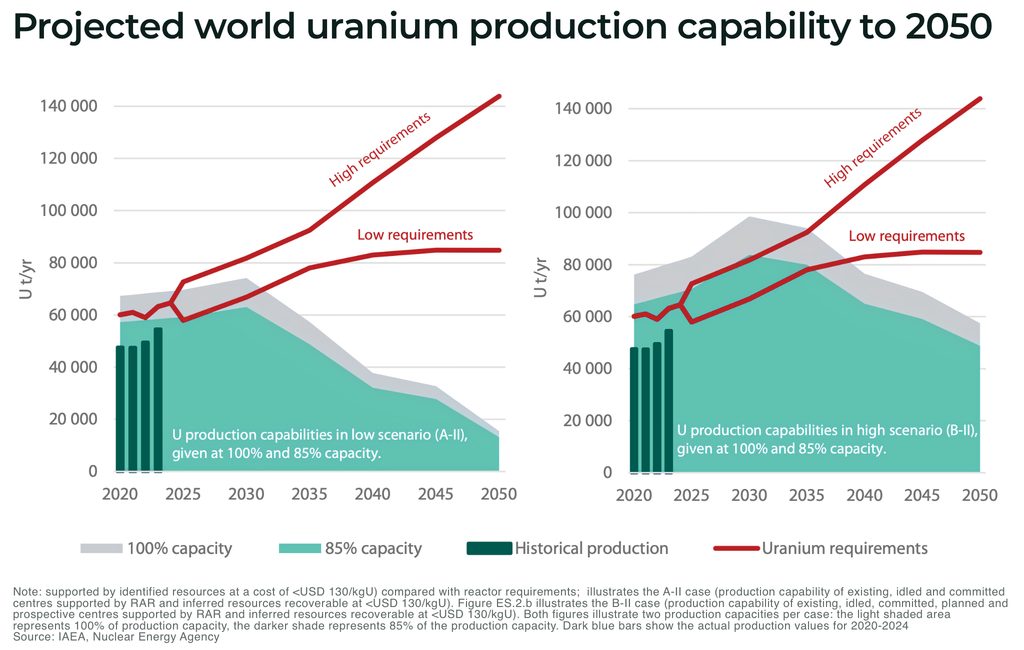
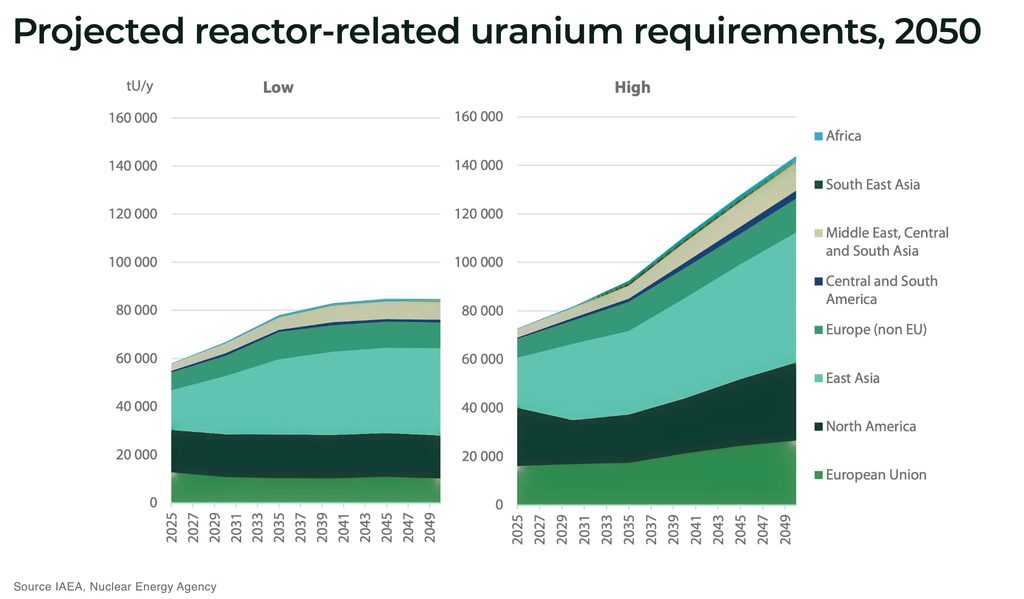
The challenge is that buyers across the world are struggling to replace fuel-cycle capacity ahead of incoming demand, with projections of a potential 46,000-tonne uranium supply shortfall by 2040.
The emerging divide is not just geographical, but runs through ownership, contracts, transport routes and processing plants. In other words, the East-West split is being driven by governments and utilities reorganising who finances supply, who controls its sale and which facilities can turn it into usable reactor fuel.
Uranium price dynamics are no longer simply about how much uranium is produced, but who can secure it, process it and deliver it to a securely to the reactor.
The new global nuclear buildout deepens the East–West divide
The US, Canada, EU, UK, Switzerland, Japan and South Korea together have 281 reactors classed as operable, compared with 98 in China and Russia.
But, China has 38 nuclear reactors under construction — the fastest rate of any country in the 21st century — and Russia have 7 reactors under construction, against 11 across that Western group, based on World Nuclear Association figures.
| Reactor count | China + Russia | Western comparison group |
| Currently classed as operable | 98 | 281 |
| Under construction | 45 | 11* |
| Planned | 66 | 30 |
| Existing fleet + construction pipeline | 143 | 292 |
| Existing fleet + construction + planned | 209 | 322 |
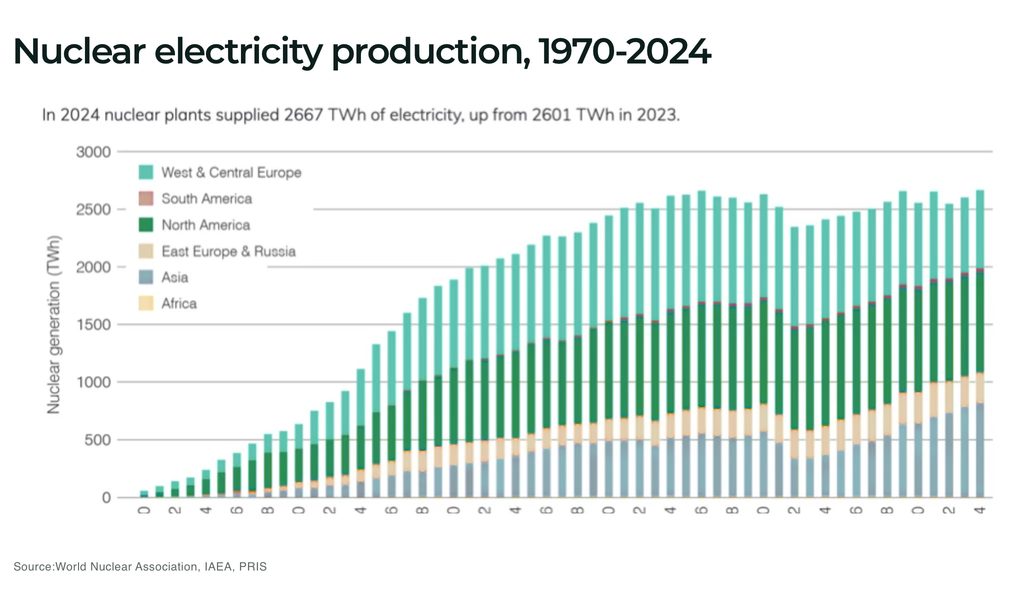
At the same time, the West — in particular, the US — is also restarting and building out its own record nucelar reactor build out under its new “Nuclear Dominance – 3 by 33” campaign. The Department of Energy wants to use the Defense Production Act to drive a seven-year rebuild of America’s entire nuclear fuel cycle: from uranium mining and milling to conversion, enrichment, fuel fabrication, recycling and reprocessing.
Global nuclear capacity is projected to reach between 641–1,045 GW by 2050, from 377.1 GW in 2025.
Every reactor will require uranium supply secured years in advance of coming online, and the West’s larger existing reactor fleet and China’s faster construction programme are increasingly creating overlapping demands to secure fuel.
The competition for uranium starts at the mine
Mines in Canada, Australia and the US produced approx 32% of global mined uranium in 2024, compared with 7% from mines in China and Russia. However, that gap narrows considerably when considering companies operating internationally:
- four major Western producer groups — Cameco, Orano, BHP and General Atomics/Quasar — accounted for approx 36% of worldwide production
- against 29% attributed four Chinese and Russian producer groups — CGN, CNNC, Uranium One and ARMZ
| Comparison, 2024 | Chinese/Russian | Western |
| Production within named countries | China + Russia: 4,338 tU / 7.2% | Canada + Australia + US: 19,167 tU / 31.8% |
| Production attributed to named companies worldwide | CGN, CNNC, Uranium One, ARMZ: 17,614 tU / 29.3% | Cameco, Orano, BHP, General Atomics/Quasar: 21,509 tU / 35.7% |
Calculations from the World Nuclear Association’s 2024 production tables, using a global total of 60,213 tonnes of uranium. The country and company comparisons cover the named groups only. Company-attributed production does not establish its ultimate export destination.
The challenge, for competing governments and utilities, the commercial pressure begins before a mine produces its first tonne. A project may enter the global supply forecast years before startup, with much of its output already committed to the customer that helped make it possible.
And a major challenge is that mine development can take 15–20 years from discovery to production.
And that future supply is exposed to long development schedules, with uranium mines taking up to 15–20 years from discovery to production — just as primary uranium mine supply faces potential 46,000-tonne shortfall by 2040 (driven by data centers and energy security).
China has spent more than a decade securing overseas uranium
China has moved early to secure future uranium supply, challenging Western producers despite their decades of mining experience, building access through international mine ownership, development financing, and long-term purchasing agreements spanning African mines, Central Asian partnerships, as well as contracts with Western producers:
Namibia provides the clearest concentration of operating assets:
Husab and Rössing uranium minesproduced a combined 6,642 tonnes of uranium in 2024 — about 91% of Namibia’s total (note: that is output at Chinese-controlled mines, not a measure of shipments to China)
- CNNC paid US$190 million for 25% of Langer Heinrich in 2014, then acquired Rio Tinto’s 68.62% interest in Rössing in 2019
- Husab’s operator is 90% owned by Taurus Minerals, a partnership between CGN and the China-Africa Development Fund
- at Etango, CNNC Overseas has agreed to invest up to US$321.5 million at completion and purchase 60% of lifetime production; Bannerman retains independent marketing rights over 40%. Its September update said investment conditions had been satisfied or waived, with completion expected that month and a final investment decision in the fourth quarter. Etango illustrates the commercial advantage of committing capital early: Chinese financing supports additional global production while reserving most of it for a Chinese buyer
In Kazakhstan, mine investment is linked to fuel manufacturing:
- CGN acquired 49% of Ortalyk for approximately US$435 million in 2021, under a wider arrangement that included guaranteed purchases from the Ulba-FA fuel assembly plant. By the end of 2024, Ulba-FA had reached 200 tonnes of low-enriched uranium in fuel assemblies annually, all supplied to Chinese nuclear plants
- separately, a Chinese-owned company acquired Uranium One’s 49.979% interest in Zarechnoye in December 2024, transferring an existing Russian interest to China rather than creating a new mine
The strategy also extends to exploration and independent suppliers:
- Uzbekistan’s Navoiyuran announced cooperation with Chinese nuclear companies in October 2025, alongside exploration under an earlier agreement. These are potential sources, not established new production.
- Cameco’s 2022 supply agreement with a CNNC subsidiary, whose individual volumes remain confidential, also shows that Western producers supply China
These arrangements show why the uranium market’s emerging divide cannot be drawn neatly on a map, but this diversity of China’s options, with ownership and contracts, helpssecure access.
The challenge for Western utilities to secure new uranium increasingly means making commitments early enough to influence which mines get built and who receives their production.
The West is moving to secure future mine supply
The West is now moving to catch up, with utilities and governments purchasing commitments to strengthen access to primary uranium supply, including:
US utilities are committing before production begins.
- NexGen’s August 2025 agreement for five million pounds brought its contracted sales to 10 million pounds across four US utilities. The contracts establish customers for Canada’s Rook I project; they are not utility equity investments. The project subsequently received its federal site-preparation and construction licence in March 2026
Washington has purchased domestic material:
- under DOE’s Strategic Uranium Reserve programme, Energy Fuels sold 300,000 pounds for approximately US$18.5 million in January 2023, while UEC supplied 300,000 pounds for US$17.85 million. NNSA described these as purchases of already-mined uranium, they supported producers’ revenues and a federal reserve, rather than directly funding new mine construction
France is diversifying overseas production:
- Orano’s January 2025 agreement with Mongolia envisages US$500 million of initial investment and US$1.6 billion over the Zuuvch-Ovoo project’s lifetime. Mongolia’s position between Russia and China means French backing alone does not establish an independent delivery route, nor does the agreement reserve all output for Western buyers
The mechanisms differ, but each addresses access to supply. For utilities, early commitments can help underpin mine development while securing a share of future production.
The sharpest divide is in enrichment
For most commercial reactors, mined uranium must pass through conversion, enrichment and fuel fabrication before it can be used by nuclear reactors as fuel to generate electricity.
The World Nuclear Association (WNA) projects global enrichment capacity will grow approximately 24% between 2022 and 2030, reaching 77.8 million separative work units a year—the industry’s measure of enrichment capacity. Globally, it expects capacity to exceed demand into the early 2030s.
But that apparent surplus masks a growing divide over who can access it. Western utilities are seeking alternatives to Russian enrichment, while China expands capacity principally to meet its own reactor fleet’s requirements. More capacity worldwide therefore does not automatically mean more supply available to Western buyers — a distinction behind the WNA’s assessment that the market has become increasingly regionally “segmented” since 2022.
China’s enrichment capacity is projected to grow almost 72% between 2022 and 2030, compared with approximately 24% globally. The expansion highlights the significance of China’s nuclear build out on the market:
- China’s CNNC: annual capacity rises from 10.6 million to 18.2 million SWU, approx half the net global increase in the WNA projection
- Russia’s Rosatom: capacity increases from 27.1 million to 29.8 million SWU, preserving its position as the largest enrichment supplier
Europe remains arguably most exposed: Russia supplied ~22.55% of EU enrichment deliveries in 2025, while Rosatom provided 24.40% of conversion services; for example, Ukraine’s agreement with Cameco, covering all natural uranium hexafluoride requirements for nine reactors from 2024 to 2035, illustrates procurement extending beyond ore to conversion.
Western expansion faces a timing test
The US ban on Russian low-enriched uranium began in August 2024, and whilst waivers allow specified imports where alternatives are unavailable or imports serve the national interest, they are subject to annual limits and the January 2028 deadline ending all imports.
Western suppliers are responsing by working to build their own enrichment alternatives, including:
- in January 2026, the Department of Energy announced US$2.7 billion in enrichment awards over ten years, covering conventional low-enriched uranium and HALEU for advanced reactors
- Urenco’s latest programme calls for 4.6 million SWU of additional annual capacity across the US, Netherlands and Germany over the next decade
- Orano is adding 2.5 million SWU in France, with production starting in 2028 and full capacity expected by 2030
| Project | Additional annual capacity | Announced timing |
| Urenco USA ongoing expansion | 700,000 SWU | Completion in 2027; capacity entering service progressively |
| Orano Georges Besse II expansion, France | 2.5 million SWU | Production from 2028; full capacity by 2030 |
| Urenco USA further expansion | 2.1 million SWU | Initial production in 2032; installations through 2036 |
Selected projects, not a complete Western supply forecast. SWU measures enrichment services, not tonnes of mined uranium. Urenco’s US projects are included in its wider expansion programme and should not be added to that programme again.
US reactor operators reportedly held 118 million pounds of uranium equivalent in inventories at the end of 2025, although those holdings span different processing stages and locations, so the immediate risk is not a single cliff edge but a long, difficult transition.
But the entire package cannot be counted as near-term replacement capacity for today’s fleet. So, the schedules leave utilities managing a transition between the legal deadline and later capacity additions.
The result is a market in which additional capacity does not translate automatically into supply available to every buyer.
These investments support a market increasingly organised around security of supply: which mines buyers can access, which processors they can rely on, and which governments can interrupt deliveries.
F3 Uranium: building the pipeline for future supply
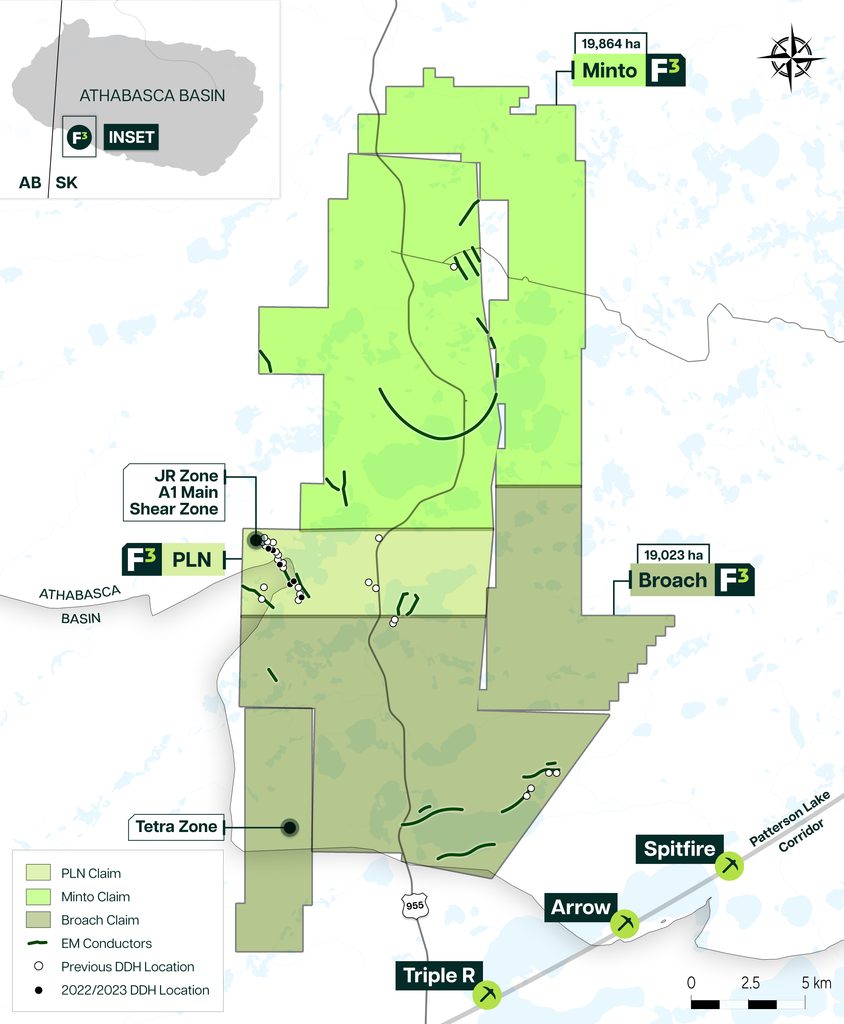
F3 Uranium Corp (TSXV: FUU, OTCQB: FUUFF) owns 100% of the Patterson Lake North project in Saskatchewan’s western Athabasca Basin, comprising the Patterson Lake North, Broach and Minto properties.
The project’s most advanced asset is the JR Zone contains a Mineral Resource Estimate (MRE) of Indicated resource of 11.801 million lb U3O8 grading 4.41%, including a high-grade domain of 10.8 million lb grading 12.23%.
| JR Zone domain | Classification | Tonnes | Grade | Contained U3O8 |
| High-grade domain | Indicated | 39,997 | 12.23% U3O8 | 10.788 million lb |
| Low-grade domain | Indicated | 81,262 | 0.57% U3O8 | 1.031 million lb |
| Total JR Zone | Indicated | 121,259 | 4.41% U3O8 | 11.801 million lb |
Mineral Resources are reported at a cut-off grade of 0.255% U3O8. Figures are reported by F3; totals may not add precisely because of rounding.
The company is also testing the wider potential of the project with its newer Tetra discovery approx 13 km south of JR, as well as the company’s 2026 exploration programme advancing targets across the Patterson Lake North, Broach and Minto properties.
Drilling at Tetra has returned several mineralised intervals, including 3.0 metres grading 1.19% U3O8 and a separate 13.0-metre interval grading 0.28%. Subsequent step-out drilling intersected further mineralisation, supporting the geological case for a wider system while leaving its eventual size and grade currently unresolved.
F3 reported C$25.4 million in cash and redeemable term deposits at December 31, 2025, before completing a further C$5.55 million flow-through financing in April 2026.
Canaccord Genuity has initiated coverage on F3 Uranium with a Buy rating and a ~CAD$0.30 targe~t. Other broker targets are materially higher: SCP at CAD$0.70, Red Cloud at CAD$0.55, and Haywood at CAD$0.40.
With a 100%-owned, independently estimated Indicated resource, an unusually high-grade core and a road-accessible land package containing several further targets, F3’s story is shifting from high-grade resource to district-scale system.
Kazakhstan keeps the markets connected
The dividing line cannot be drawn neatly around countries — and arguably the most important frontline in this divided market is Kazakhstan.
Kazakh-origin uranium represented 28% of US utility uranium deliveries in 2025 and 20.31% of EU deliveries — and, importantly, Kazakhstan remains important to Western procurement despite its proximity to Russia and China.
Kazatomprom’s March 2026 results highlighted new customers in Switzerland and the Czech Republic, alongside a Japanese utility contract. The company also reported that its Russian transit route and alternative Trans-Caspian route remained operational at the reporting date.
What does bifurcation mean for uranium prices?
The market is bifurcating by contract, infrastructure and processing capability rather than dividing into two completely separate geographic blocs.
The result is a paradoxical market. On paper, global enrichment capacity will likely comfortably exceed demand well into the next decade. In practice, utilities are increasingly confined to “their” side of a divided system: Russia-China vs Western capacity largely serving its own aligned nuclear fleets.
For uranium prices, the implication is upward pressure as utilities compete more intensely for the pounds available. That can also strengthen producers’ negotiating position (for the first time in a long time) and support higher long-term contract prices, even while the spot market remains volatile. eg. Cameco identifies this competition for reliable, long-term uranium supply as a growing market driver.
This brings complications for buyers and investors — putting a premium on security of supply and price.
Q&A
What is uranium market bifurcation?
The growing separation of nuclear fuel procurement and processing networks as Western buyers reduce Russian exposure and China secures long-term supply. The enrichment market is already regionally segmented.
When do US waivers for Russian enriched uranium end?
Under existing law, all waivers must terminate by 1 January 2028. The import prohibition began in August 2024.
Does a mine outside Russia and China automatically supply Western buyers?
Ownership and contracts determine access. At Etango, a Chinese partner has agreed to purchase 60% of lifetime production, while Bannerman independently markets the remaining 40%.